Journalist
Published in: June 28, 2024
- Despite high network activity, LTC is down almost 15% in the last 30 days.
- Most metrics and indicators pointed to a continued decline in prices.
Litecoin [LTC] has failed to generate profits for investors as it continues to fall down the list of top 30 cryptocurrencies. However, the coin managed to excel on one particular front.
In fact, Litecoin eclipsed both Bitcoin [BTC] and Ethereum [ETH]which seemed quite optimistic for the future of blockchain.
Litecoin Overtakes Bitcoin and Ethereum
Litecoin recently posted a tweet pointing out an interesting development. According to it, LTC continued to dominate BTC and ETH in terms of genuine active addresses.
This clearly signified the increase in LTC adoption and high network usage in recent months.
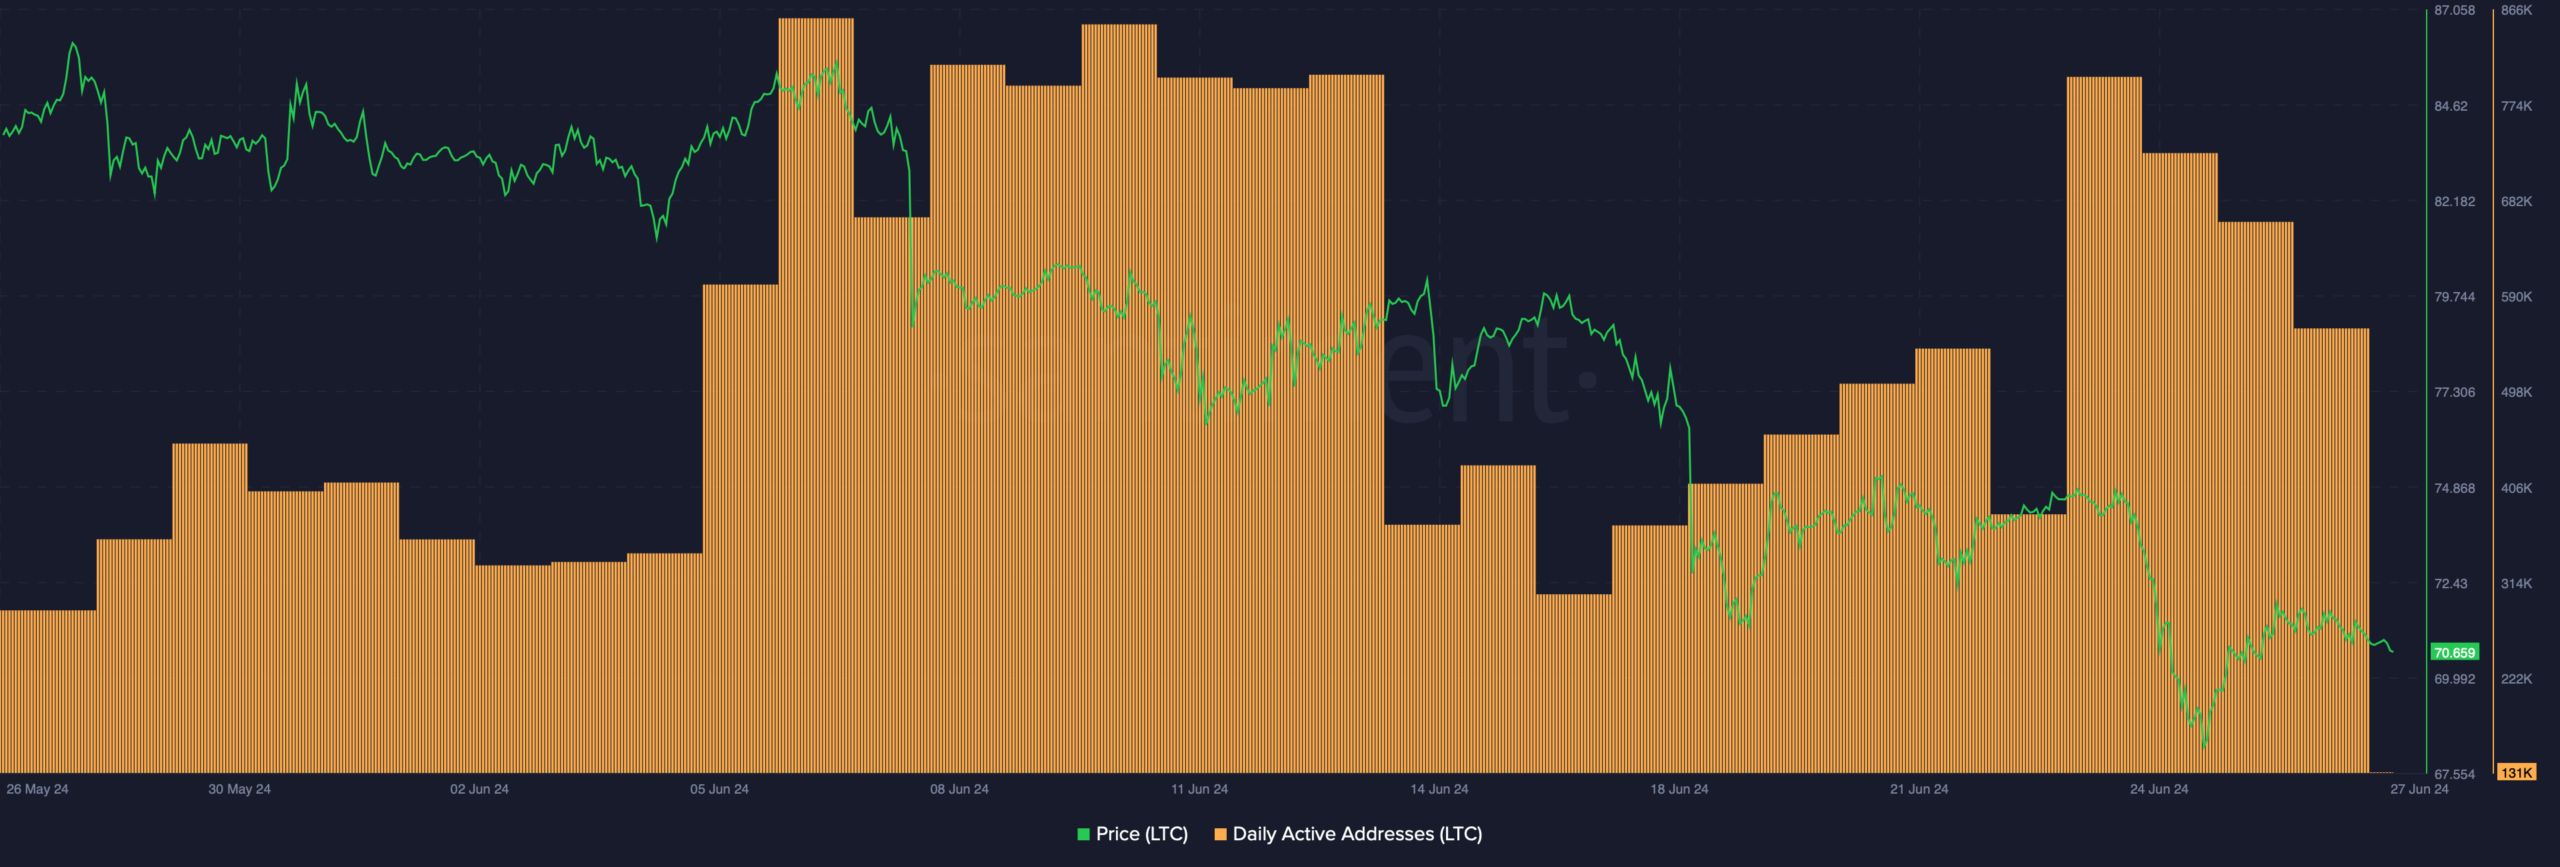
In fact, AMBCrypto’s analysis of Santiment data also revealed a similar picture. Litecoin’s daily active addresses remained high over the past 30 days as the number surpassed 858,000 on June 6.

Source: Santiment
LTC bulls take a backseat
While the activity and usage of the blockchain network was commendable, the same cannot be said for the LTC price action. Data from CoinMarketCap revealed that the price of LTC fell by almost 15% in the last 30 days.
At the time of writing, LTC was trading at $70.61 with a market cap of over $5.27 billion, making it the 22nd largest cryptocurrency.
Things may get worse for LTC in the coming days as a key metric hints at a price correction.
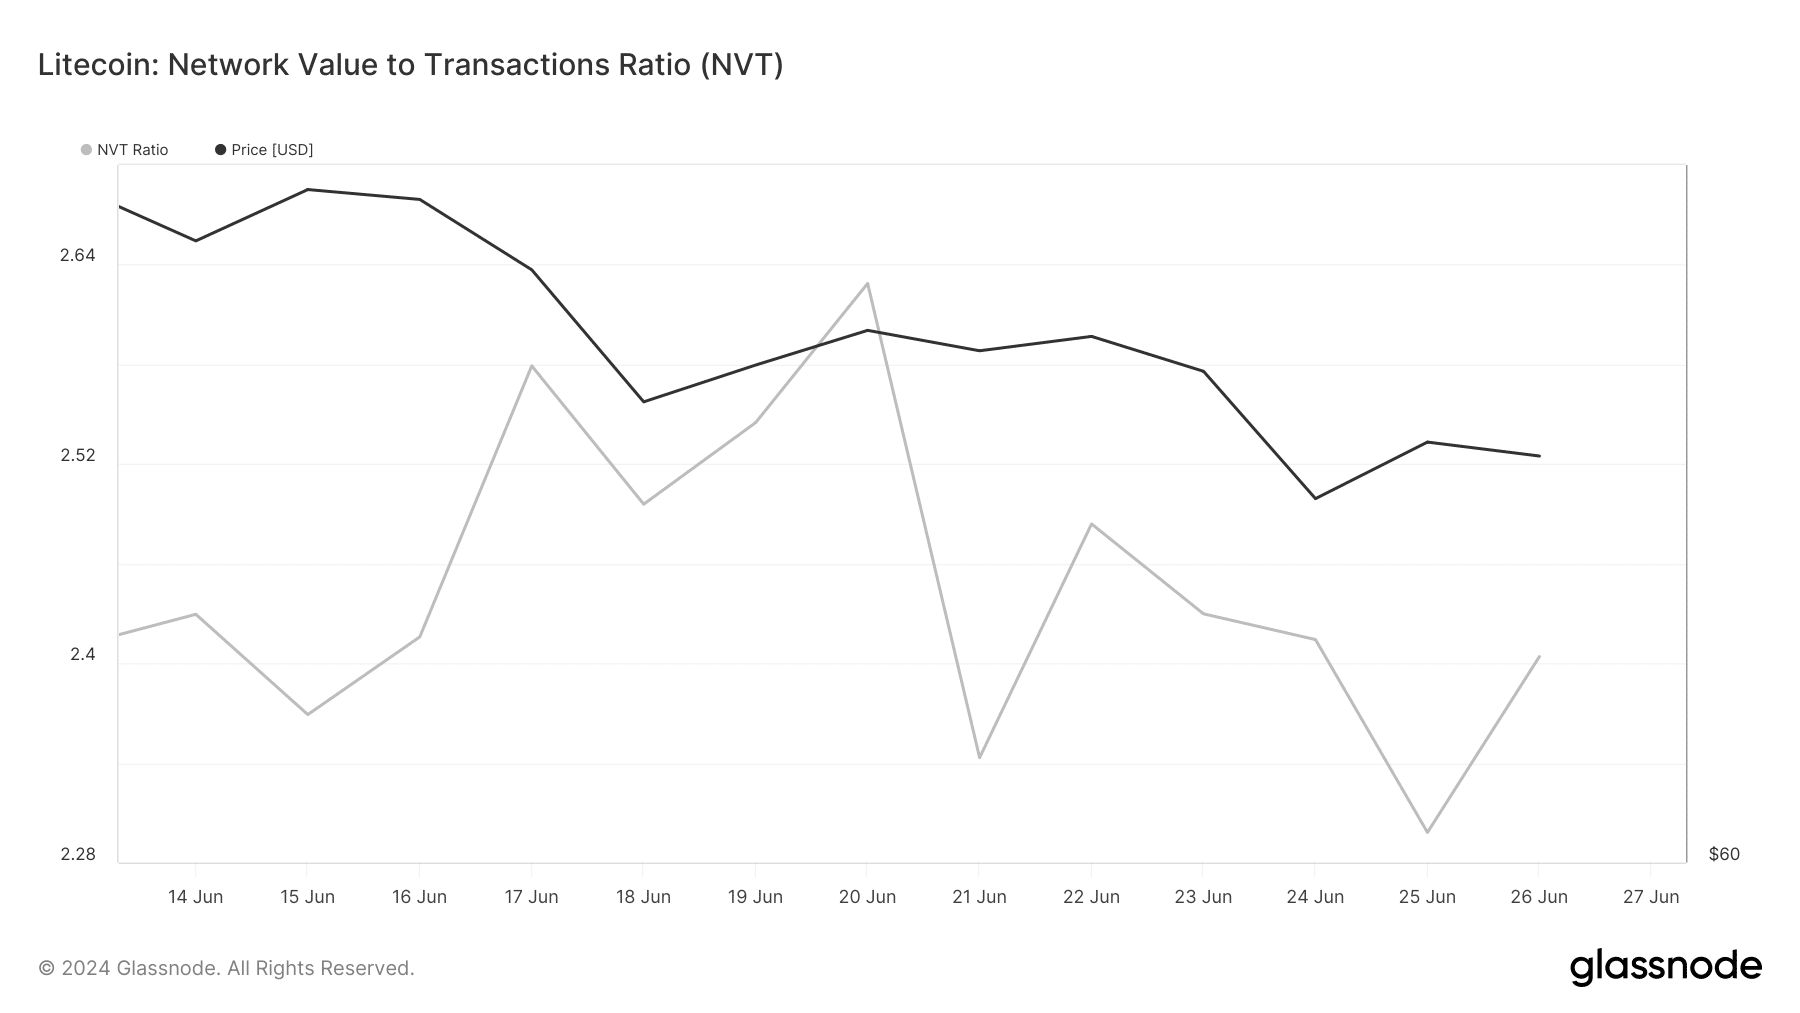
AMBCrypto’s analysis of Glassnode data clearly revealed a spike in the coin’s NVT ratio. Typically, a rise in the metric indicates that an asset is overvalued, increasing the chances of a price drop in the following days or weeks.
For the uninitiated, the NVT ratio is calculated by dividing the market capitalization by the volume transferred on chain, measured in USD.

Source: Glassnode
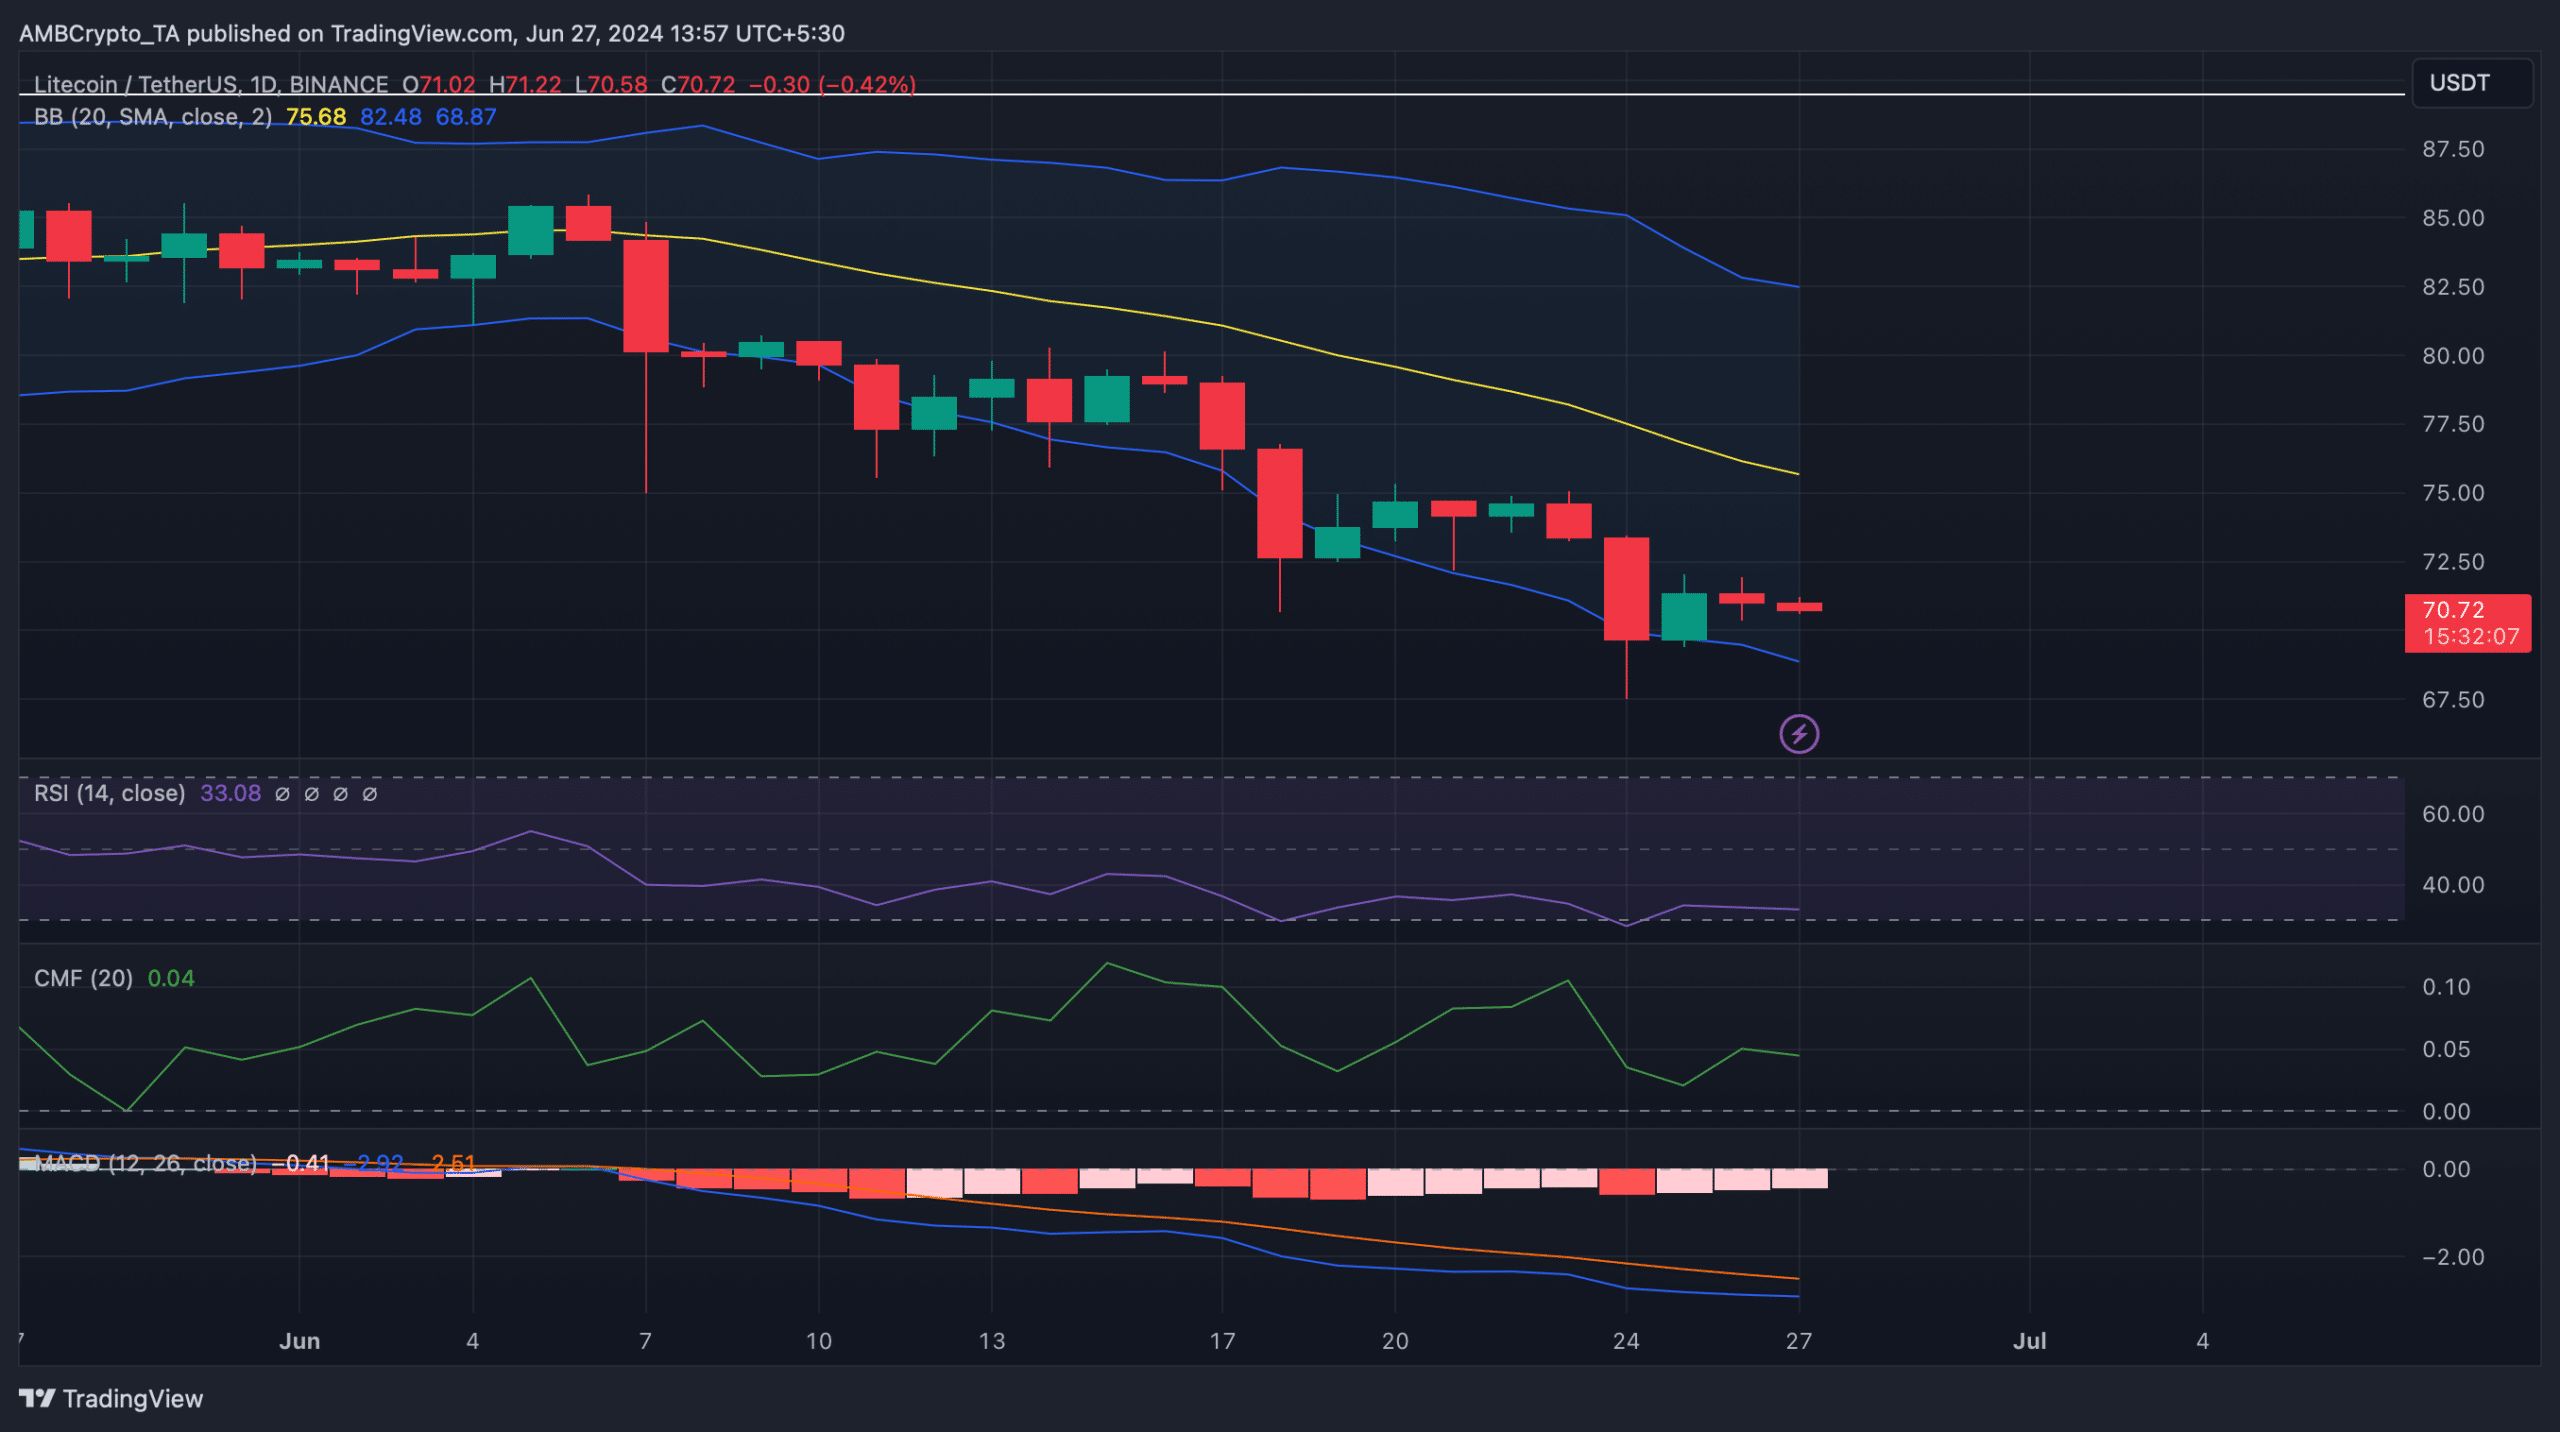
To see if the bears would continue to dominate, AMBCrypto analyzed the daily chart of Litecoin. We found that most market indicators were in favor of the sellers.
For instance, the MACD showed a bearish edge in the market. The Chaikin Money Flow (CMF) registered a decline and headed towards the neutral mark.
A similar downward trend was also observed on the Relative Strength Index (RSI) chart, suggesting a continued decline in prices.
However, LTC price had touched the lower boundary of the Bollinger Bands, which hints at a possible recovery soon.

Source: TradingView
Whether realistic or not, here is LTC’s market cap in terms of BTC
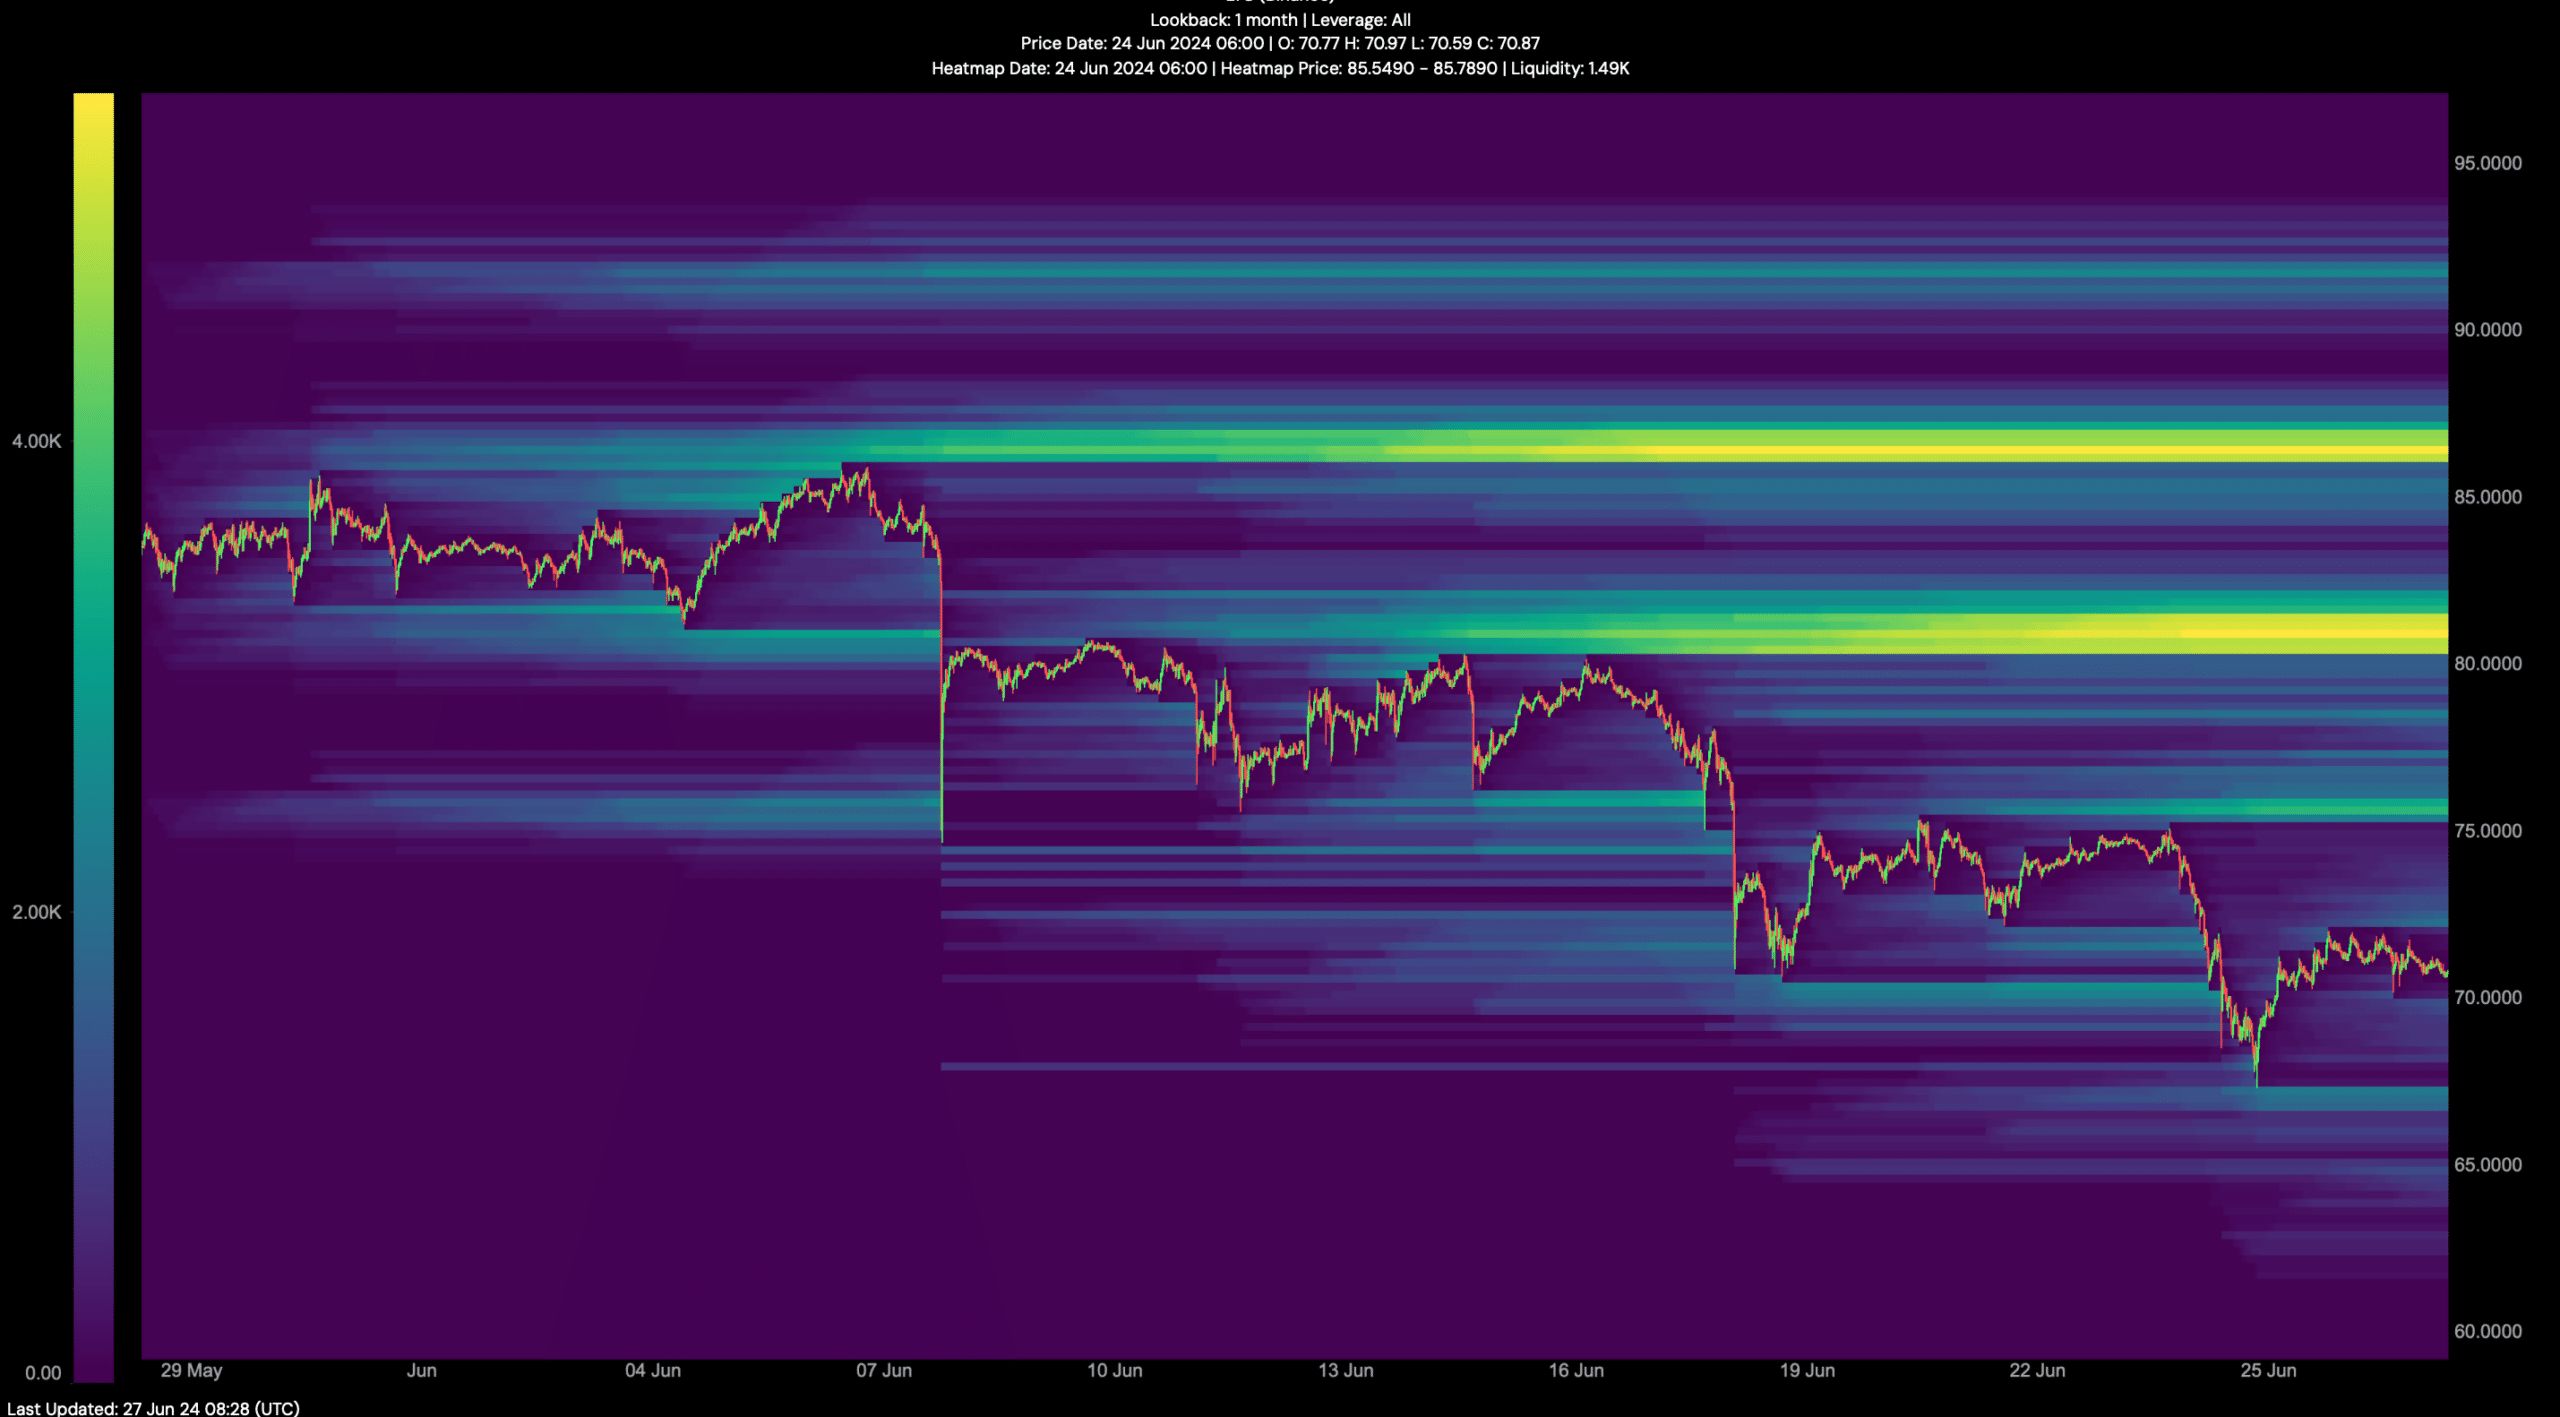
Our analysis of Hyblock Capital data revealed that if the price decline continues, investors could see LTC drop to $67 in the coming days.
However, in the event of a trend reversal, LTC could first target $81.4 to begin a full recovery.

Source: Hyblock Capital
Next: Bitcoin: ‘Be prepared for very boring price action for many more weeks’
This is an automatic translation of our English version.
Previous: PEPE bides its time near key support: can it reverse losses since May?
Next: Tron daily active users hit 2.5 million – here’s what it means for TRX prices


