- Bitcoin stabilized above its $60,970 support level: a sign of market strength
- However, popular analyst Zen predicts a possible drop to $60,150 or $53,000.
Over the past 24 hours, Bitcoin’s price appreciated by 1.34% to trade at $61,571 on the charts. The rally highlighted a market that is strengthening, especially with a market capitalization that reached $1.214 trillion and a daily trading volume of $22.06 billion.
The Bitcoin price action also revealed its immediate support at $60,970 and resistance levels at $62,000 and $62,250. In fact, the recent surge above $61,500 meant that the breakout of the support level is now behind us. Zen’s forecast
and the price may be stabilizing above the critical range of $60,622 – $59,600.
This stabilization aligns with Zen’s previous analysis on the potential for a rebound from the bottom of the range, if the price sustains above these levels.
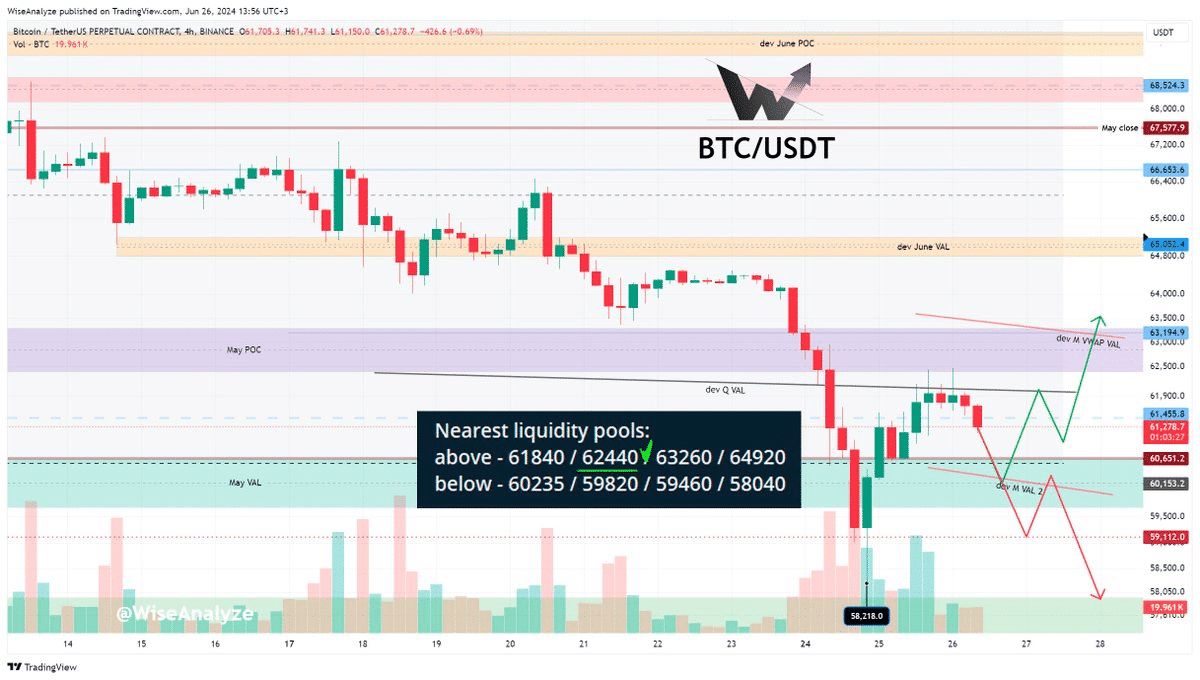
It is also worth noting here that Zen predicted a possible drop to $60,150, citing liquidity cleared below $60,630 and a lack of volume in overnight trading. He pointed to the bearish trend on the daily chart and the bullish trend on the monthly chart, suggesting a mixed but potentially bullish outlook in the medium term.
Finally, Zen highlighted the possibility of Bitcoin falling to $53,000, which aligns with the monthly time frame. However, this remains a very speculative possibility as it would require BTC to fall by more than 10% on the charts.
Source: X
Observations of Zen’s liquidity pool revealed that the closest funds are at $61,540 and $62,540, above its price at the time of this publication, and at $60,260 and $59,440 below it. Simply put, Bitcoin’s proximity to these liquidity pools, especially the one near $61,540, could potentially influence near-term price action.
Input data analysis
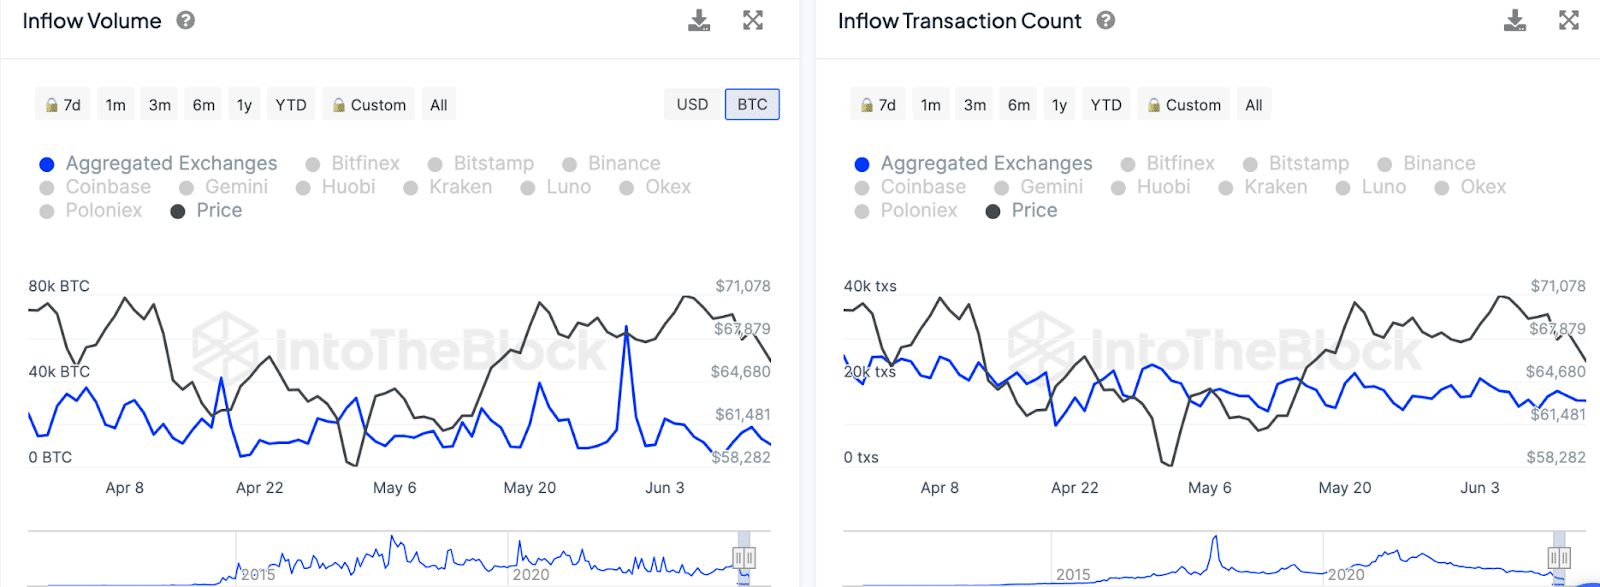
Elsewhere, inflows have fluctuated significantly, with notable spikes in late April and early June. These spikes often coincide with price changes, indicating that large volumes of Bitcoin moving to exchanges may precede price volatility. Transaction count data also highlighted similar patterns, with increased activity correlated with price movements.
Source: IntoTheBlock
In fact, from April 8 to 22, both inflows and trading volumes were high, consistent with a price drop from $71,078 to $58,282.
In late April and early May, spikes in inflow volumes and the number of transactions corresponded with price spikes of around $64,680 and $67,879, respectively.
Finally, early June saw multiple spikes in these metrics, with the price trending around $61,481, close to the current level on the charts.
So, these are all levels and metrics worth analyzing to get an idea of the future price behavior of the cryptocurrency.
Next: XRP’s bullish move: a look at Solana’s role
This is an automatic translation of our English version.