- A falling wedge pattern formed on the ONDO chart, which could trigger a 50% rally.
- Most market metrics and indicators seemed optimistic.
ONDO bears continued to dominate the market last week as the price chart remained in the red. However, investors need to be patient as something could be brewing that could lead to a massive bullish rally in the coming days. Let’s see what’s going on.
ONDO’s latest bullish move
Data from CoinMarketCap revealed that ONDO experienced a significant price drop on June 24. It later surged but was unable to fully recover as its price was still down by more than 4% last week.
At the time of writing, the token was trading at $1.16 with a market capitalization of over $1.6 billion.
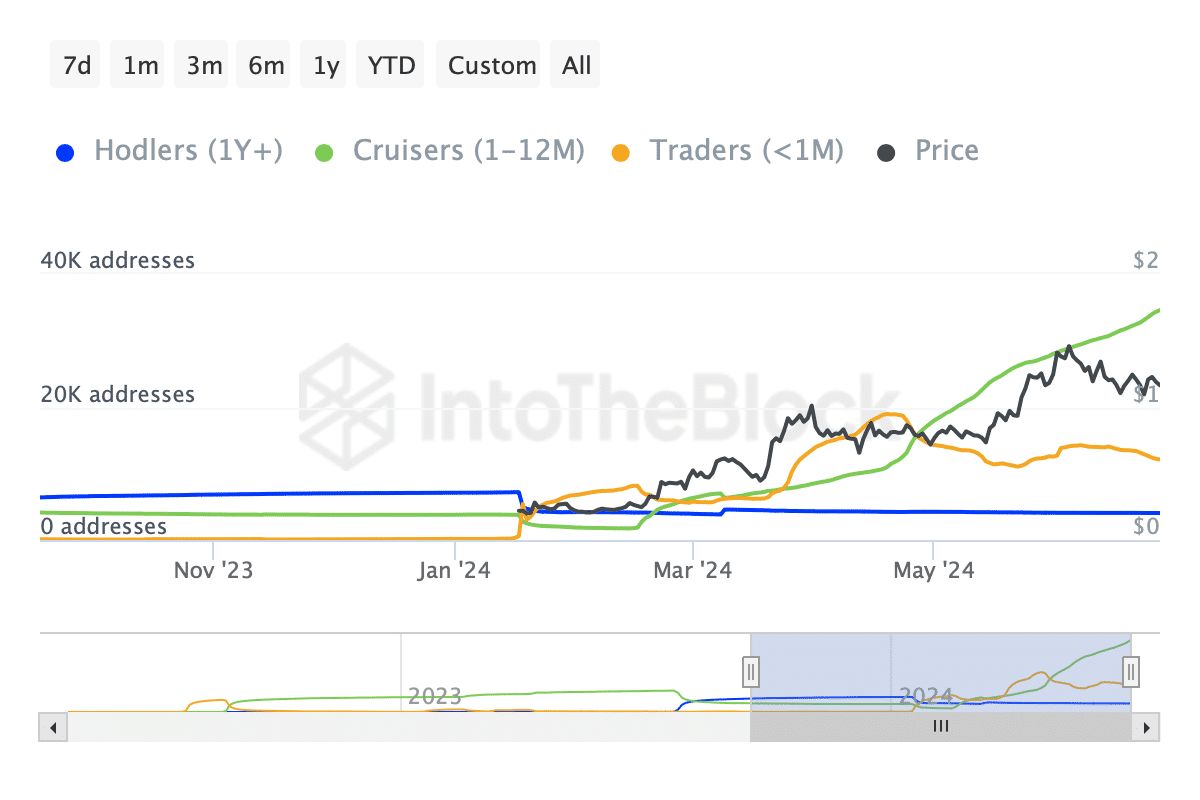
AMBCrypto’s look at IntoTheBlock data revealed that long-term holders who have held ONDO for a year have been decreasing their holdings.
On the contrary, cruise passengers, who have held the token for less than a year, showed immense interest as their numbers increased.
Source: IntoTheBlock
However, long-term holders’ interest in ONDO could also skyrocket as a bullish pattern appeared on the token’s chart.
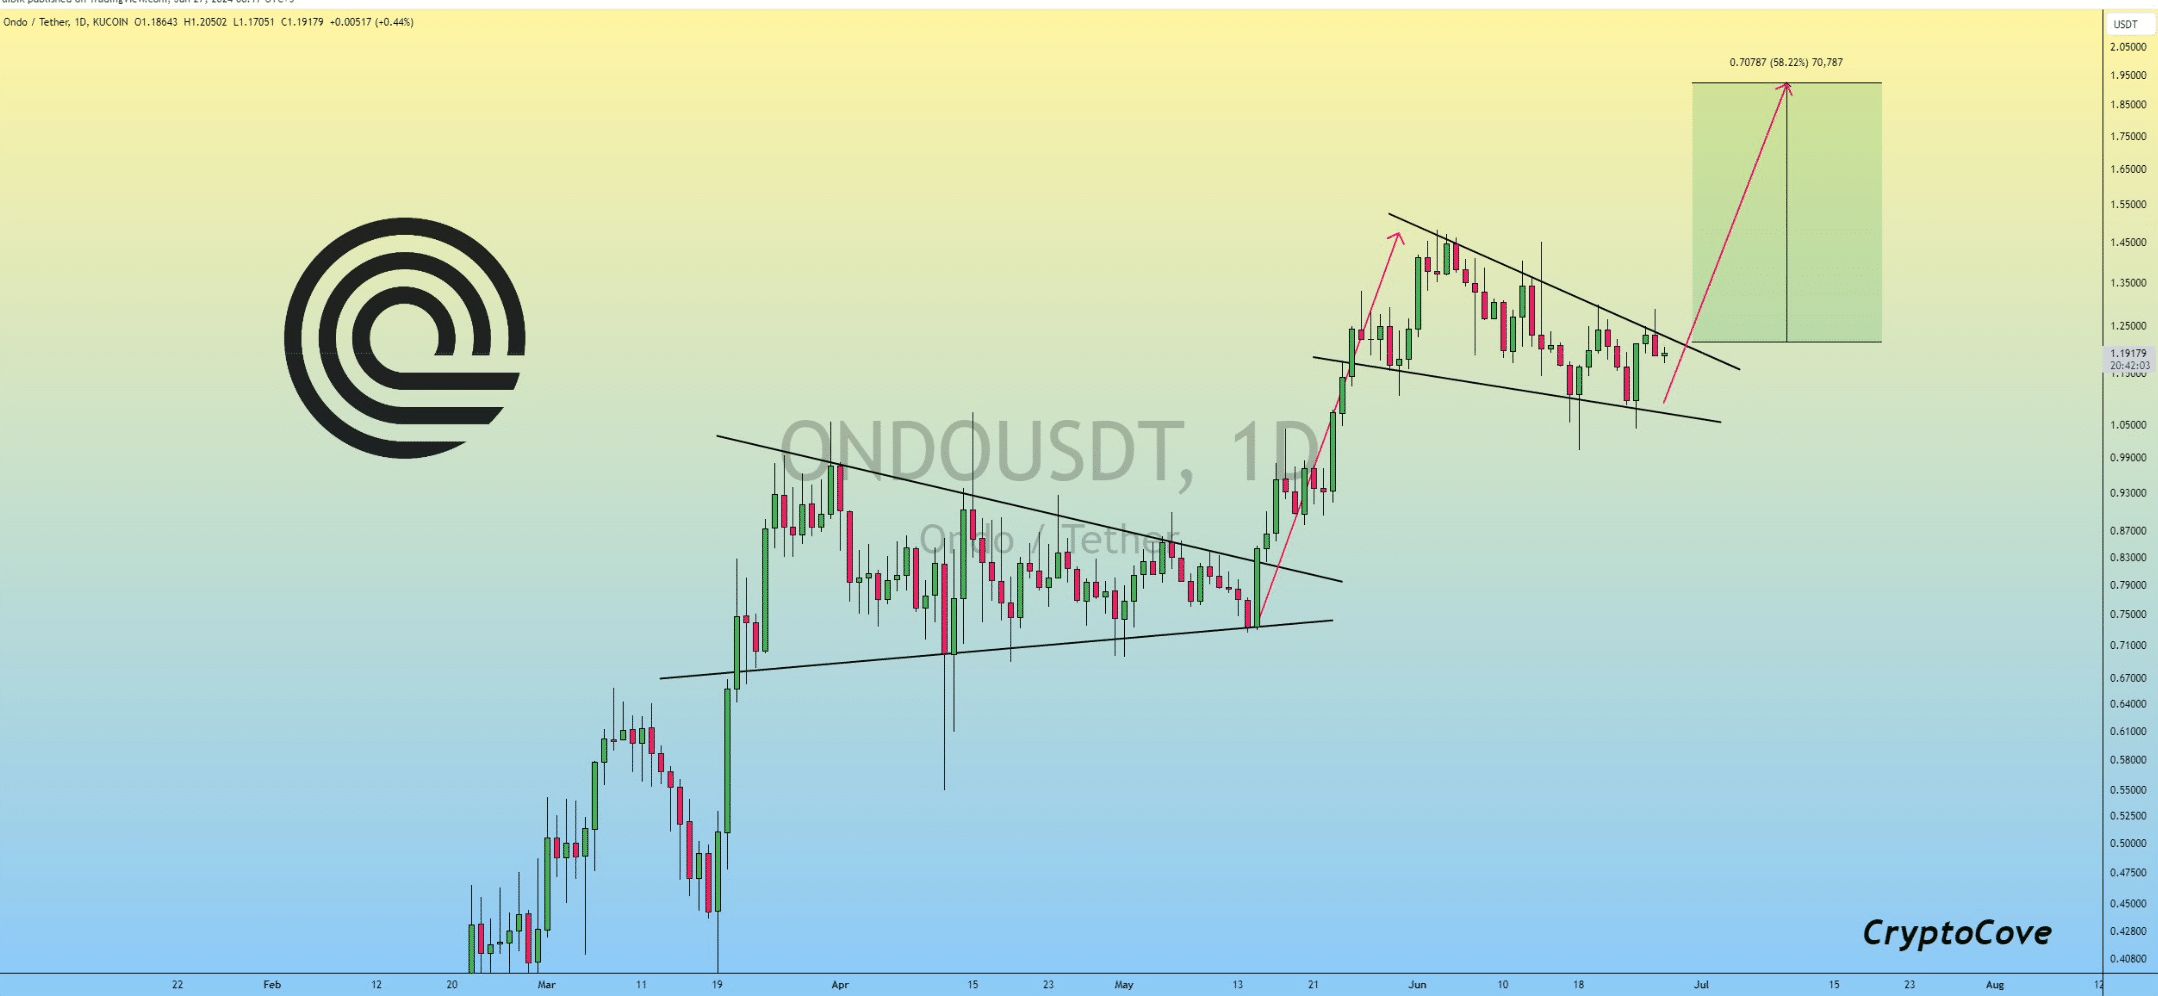
Captain Faibik, a popular crypto analyst, recently posted a tweet highlighting a falling wedge pattern. The token’s price has been consolidating within the pattern since early June and at the time of writing, was on the verge of a breakout.
A successful breakout could result in a price increase of over 50%. Interestingly, a similar pattern appeared on the token’s chart in March. ONDO broke the pattern in April, triggering a rally that ended in early June.
Source: X
Will ONDO test the bullish pattern?
Since there were chances of another bullish rally, AMBCrypto evaluated the Santiment data.
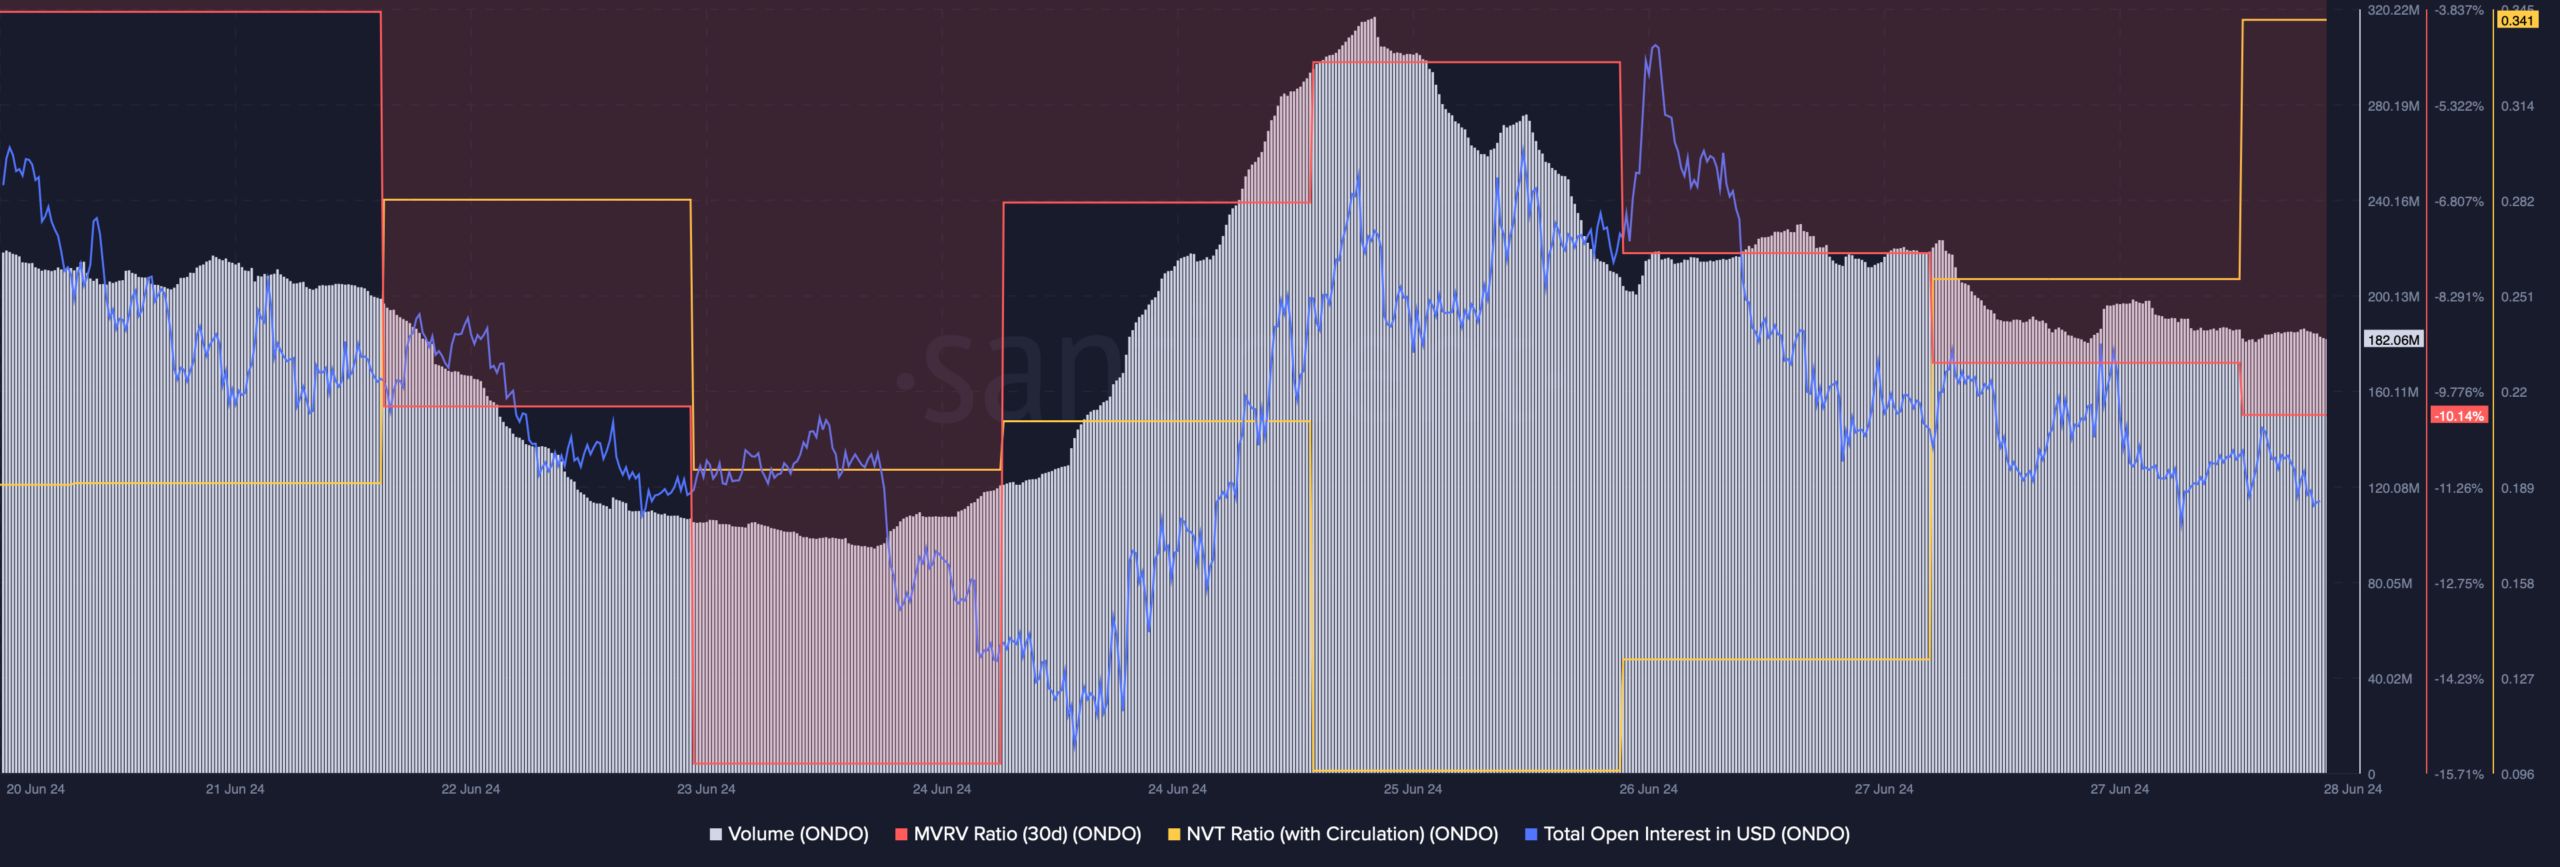
According to our analysis, the token’s volume fell along with its price, which can be inferred as a bullish signal. The token’s MVRV ratio also improved over the past few days.
Furthermore, the token’s open interest fell. Every time the metric decreases, it indicates that the chances of the current price trend changing are high.
However, ONDO’s NVT ratio increased, which meant that the token was overvalued, suggesting a continued price decline.
Source: Santiment
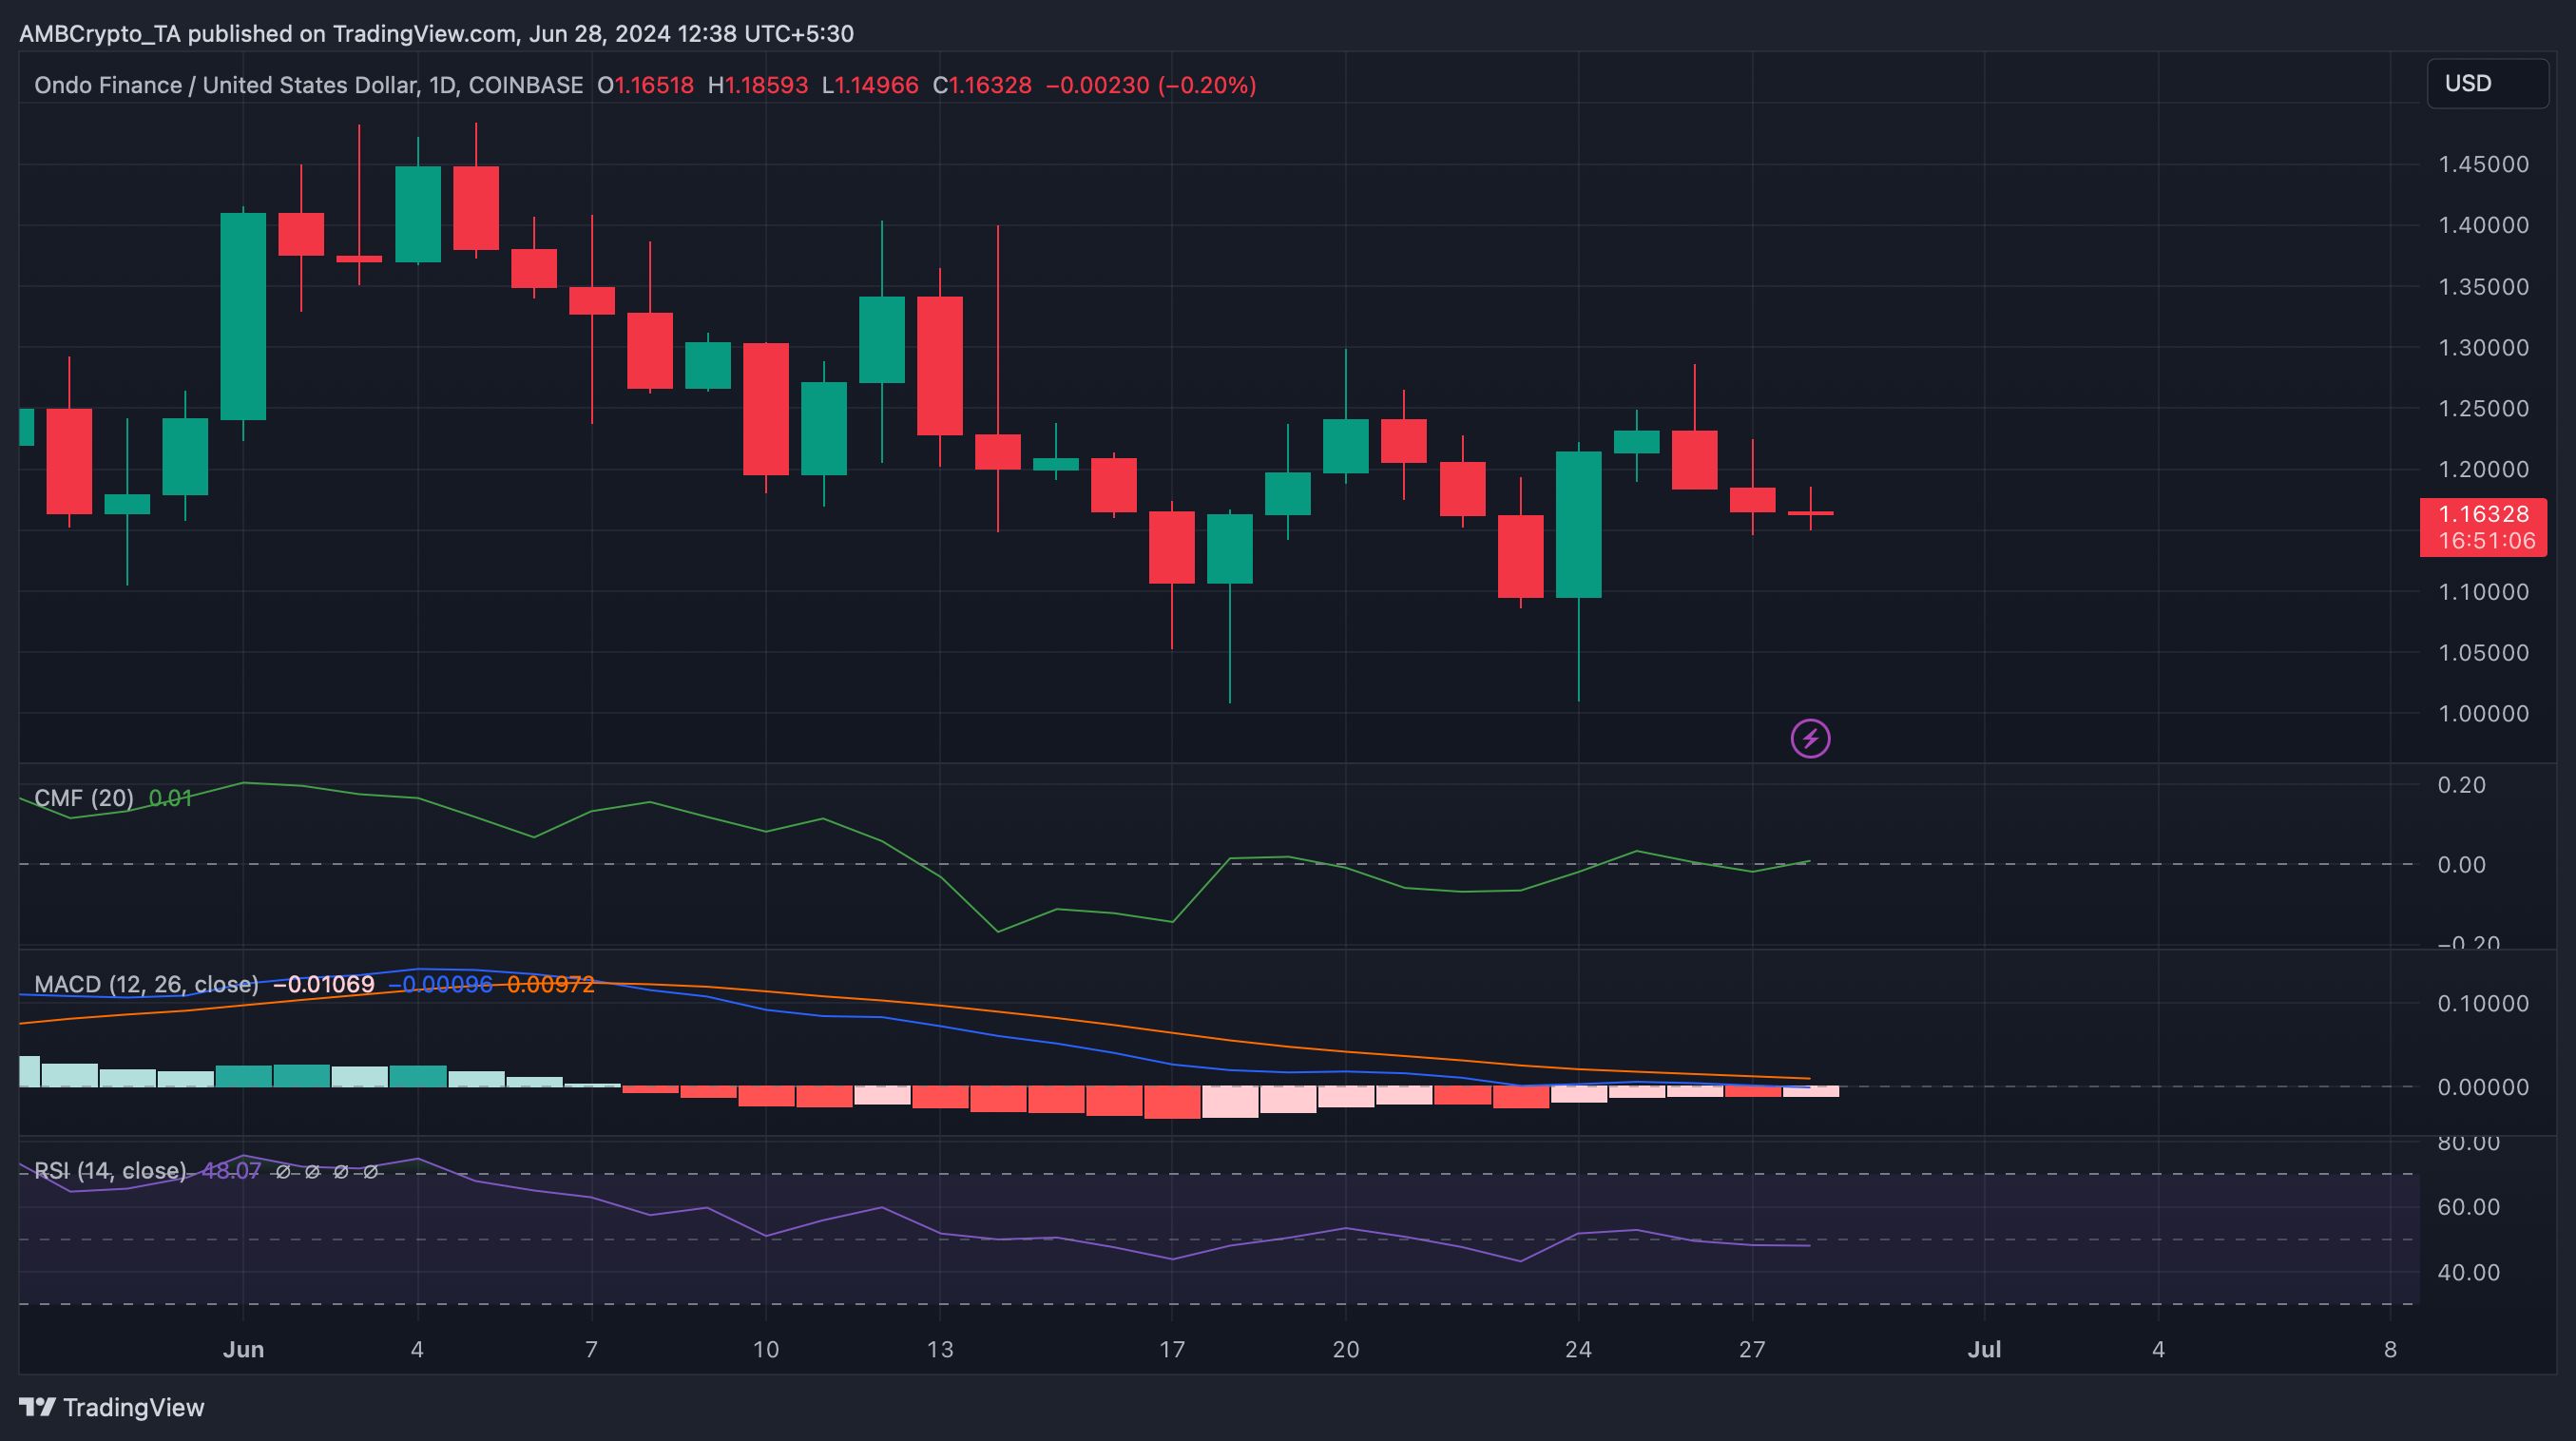
We then checked the daily chart of the token to find out if the indicators were also suggesting a price increase. The MACD technical indicator showed a high possibility of a bullish crossover.
Read ONDO Price Prediction 2024-25
The Chaikin Money Flow (CMF) registered a slight rebound, indicating a possible price increase.
However, the Relative Strength Index (RSI) was moving sideways at the neutral mark. This meant that there were chances of a few more days of slow movement.
Source: TradingView
Next: Will Bitcoin defend $60,000 as $6.6 billion options expire?
This is an automatic translation of our English version.