
Key facts:
-
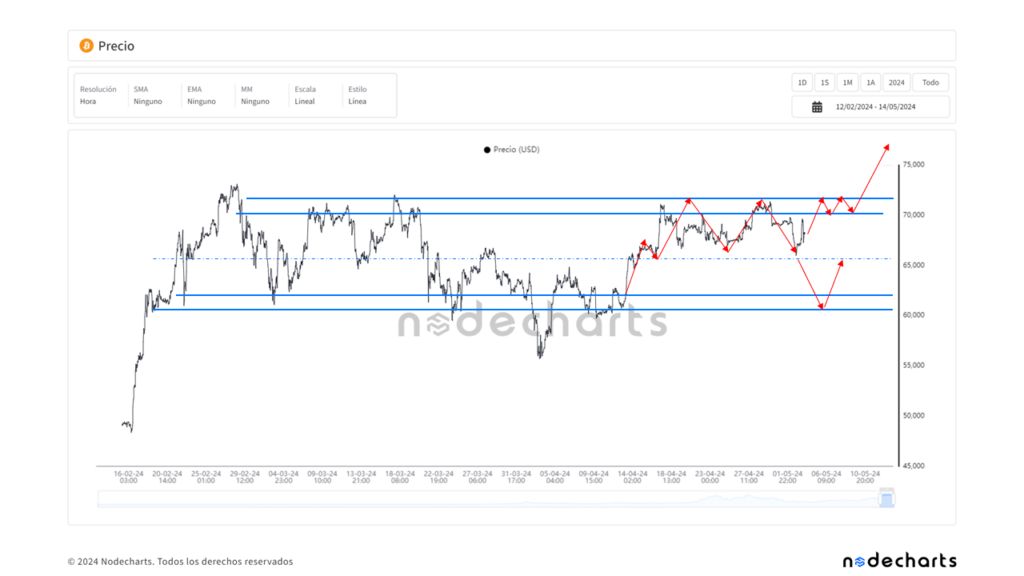
It is key that the price of bitcoin remains around USD 67,000 to recover the upward trend
-
The lateralization period may continue for weeks.
Bitcoin (BTC) has been trading for more than 100 days in a tight price range below the new all-time high of $73,700 (USD). Meanwhile, a confluence of factors portends the continuation of the uptrend.
This year there are presidential elections in the United States, something that historically it has been positive for equities, a market to which BTC is shown to be correlated. In addition to this, inflation in the economic powerhouse fell last month and the Federal Reserve (Fed) anticipated a rate cut for 2024, which favors risk demand.
“We could be about to witness a bull run in bitcoin,” commented the research firm Nodecharts. Furthermore, according to their data, there are 5 indicators that strengthen this possibility.
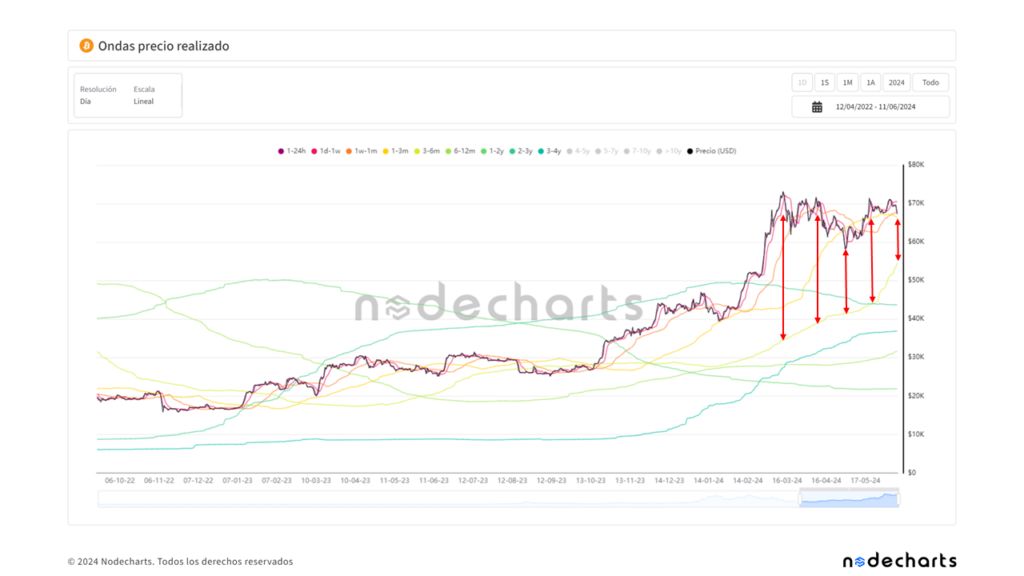
As the chart displays, the first is the realized price waves metric, which shows the value of the BTC that last moved. This shows that short-term investors, considered this way because they have had coins for less than 155 days, record losses or slight profits, which makes them more reluctant to sell. Such behavior contributes to the price not falling.
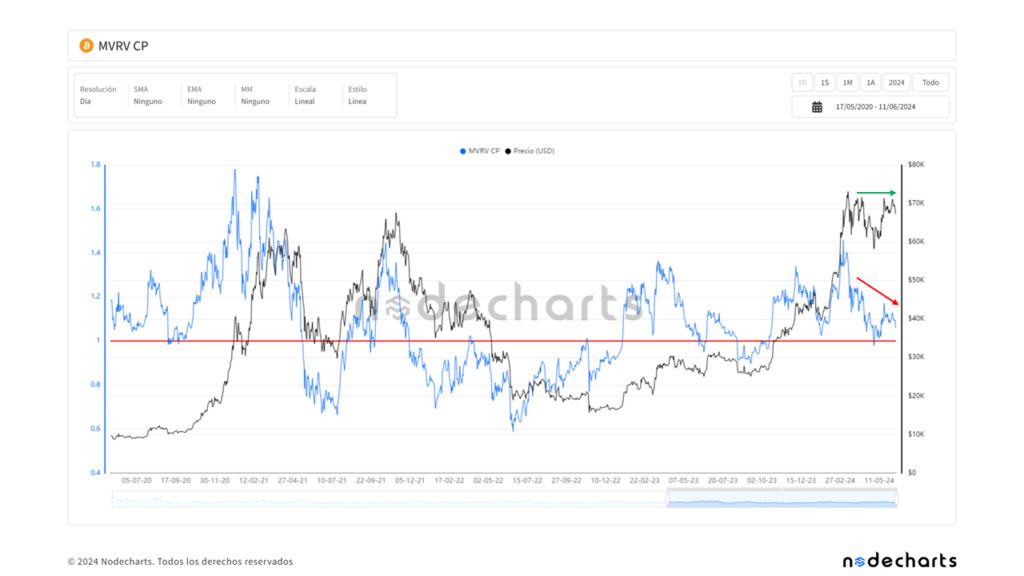
Added to it, secondly, is the MVRV CP, which identifies whether bitcoin is overvalued or undervalued in relation to the average acquisition price of short-term investors. This indicator, shown below, has been declining for three months. It is currently at the 1.1 level, reflecting unrealized gains of 6%.
The market usually reaches the peak of the bullish cycle when this metric reaches levels between 1.5 and 1.7, which indicate that short-term investors have profits of more than 50%, which is far from now. “The current values, being close to [precios] all-time highs, could help us break the range in the near future,” Nodecharts said.

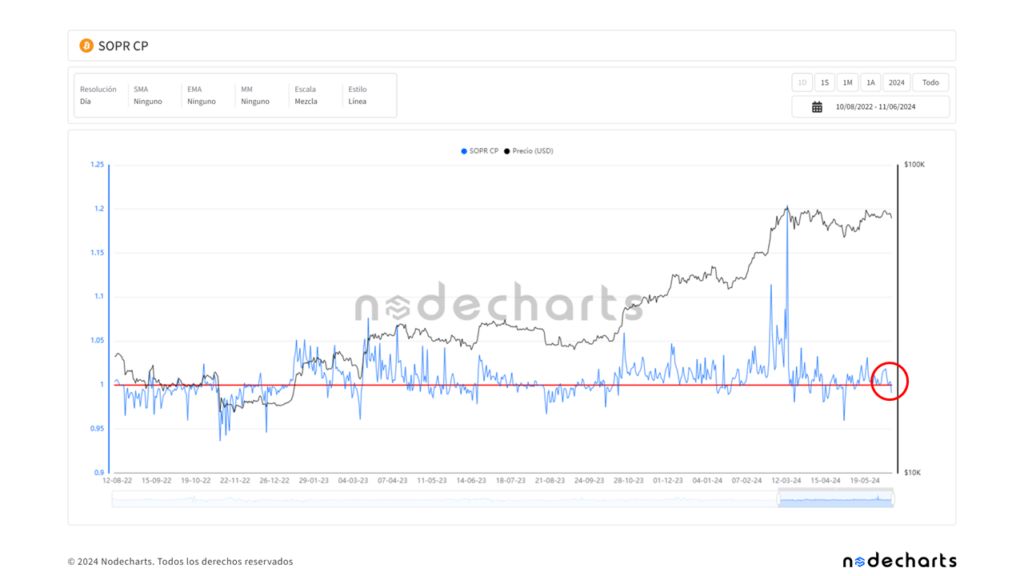
Furthermore, thirdly, this week we have seen BTC sales at losses from short-term investors. This is shown by the SOPR CP, the ratio of profit to expenditure of currencies. For Nodechart, when this behavior occurs, represents the departure of less experienced users and possible purchasing opportunities.

In fourth place, almost 5 million BTC are currently short-term users, a figure similar to that seen in the last two bitcoin cycles before surpassing its previous all-time high. This can be seen below. Therefore, if the historical trend is repeated, the market has not yet reached its bullish peak.

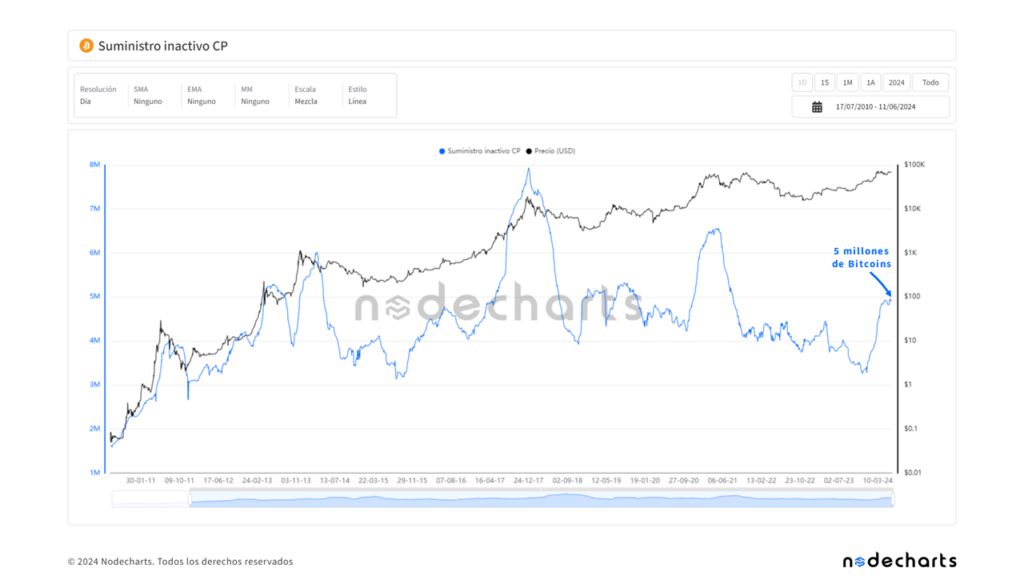
Meanwhile, fifth and last, the value of the destroyed coins, according to the 14-day moving average, is far from the current price, as the following graph shows. Given this, according to Nodecharts, “we are in a favorable context to keep our bitcoins instead of selling them.”
“Although in the short term $67,000 must be maintained to be able to consider a breakout in the coming weeks, we believe that both the metrics on-chain as factors external to Bitcoin are lining up so we could see a range breakout and a bull run sooner rather than later,” the research firm summarized.
A fall to $60,000 before a bull run is not ruled out
Should selling pressure increase, the price of bitcoin could return to $60,000. This price zone has functioned as support for the consolidation period that has been going on since its all-time high recorded three months ago. Therefore, it is a psychological area in which demand can grow.
Nodecharts agrees with analysts reported by CriptoNoticias that, If bitcoin loses the USD 67,000 zone, it will find support at USD 60,000 before reactivating the bull run. Otherwise, it predicts that it will return to USD 70,000 to overcome the consolidation zone, as shown below.

During the northern hemisphere summer, which runs from June to September, equity markets tend to fall. In this sense, demand for bitcoin may not gain much momentum until later when rates are also expected to be cut in the United States.
However, there is an event that could encourage the rise in this period. This is the launch of Ethereum exchange-traded funds (ETFs), which will be sometime in the summer, as revealed this week by Gary Gensler, chairman of the United States Securities and Exchange Commission (SEC).


