
This is going to be a quiet week, with very little data and a holiday in the middle of the week. The data will arrive on Tuesday; On Tuesday we will also know the opex of the , on Wednesday, the markets will remain closed and on Friday it will be the quarterly opex.
So it will be a little strange from that point of view. Taking into account the less than encouraging data of the last two weeks, retail sales may take on additional importance, with expectations of a 0.3% monthly increase compared to a flat month. Everything points to an increase of 0.4% compared to a decrease of 0.3% last month.
It is possible that, like the employment data, the April retail sales data was weaker due to the Easter holidays falling in March, making the May data even more critical. Better-than-expected retail sales data would certainly ease some fears that the economy is actually slowing. At the same time, a weaker figure would reinforce the hypothesis of slower growth.
Both the Citi Economic Surprise Index and the Bloomberg Economic Growth Surprise Index have been negative in recent weeks, cementing the idea that the data has been noticeably weaker recently.
The issue with the report is that, generally speaking, a weak CPI would suggest weak retail sales, since retail sales are recorded in nominal terms. Furthermore, a CPI report with a reading of 0.0%, even just one, worries me a lot because typically the only time we have seen weak inflation or changes in the inflationary trend is in times of recession.
The real clue to what the market is thinking is if we start to see Treasury rates decline and high-yield spreads widen. It’s a sign that the bond market is starting to accept that the soft landing narrative carries some risk.
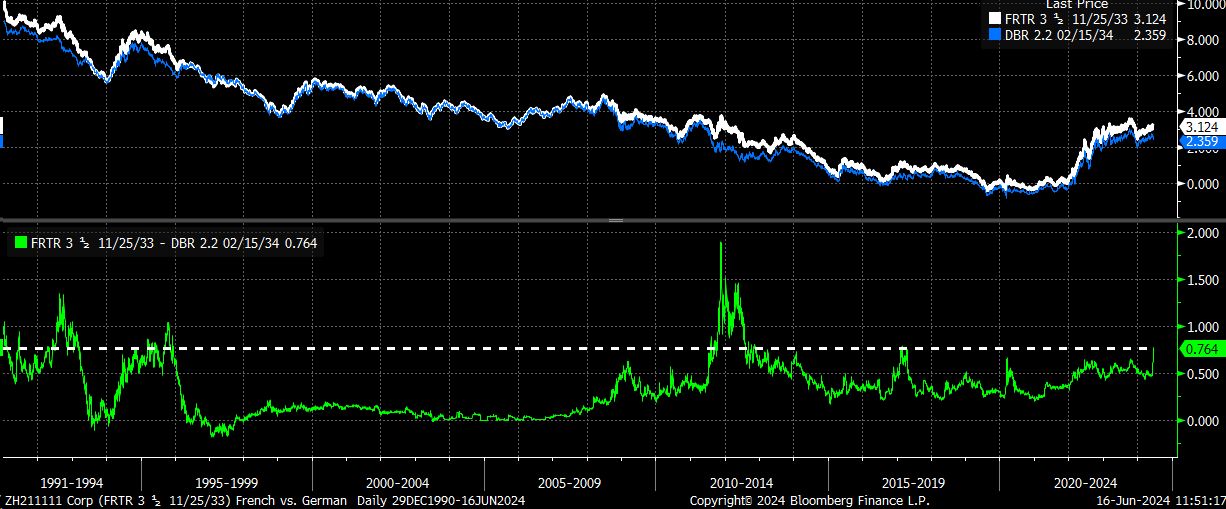
It’s hard to say right now because we’re seeing the tension in France spread across Europe, widening French and German bond spreads and causing a flight to the safety of US bonds. The spread between both bonds widened to 76 basis points on Friday, the largest margin since 2017 and the European debt crisis in 2011.
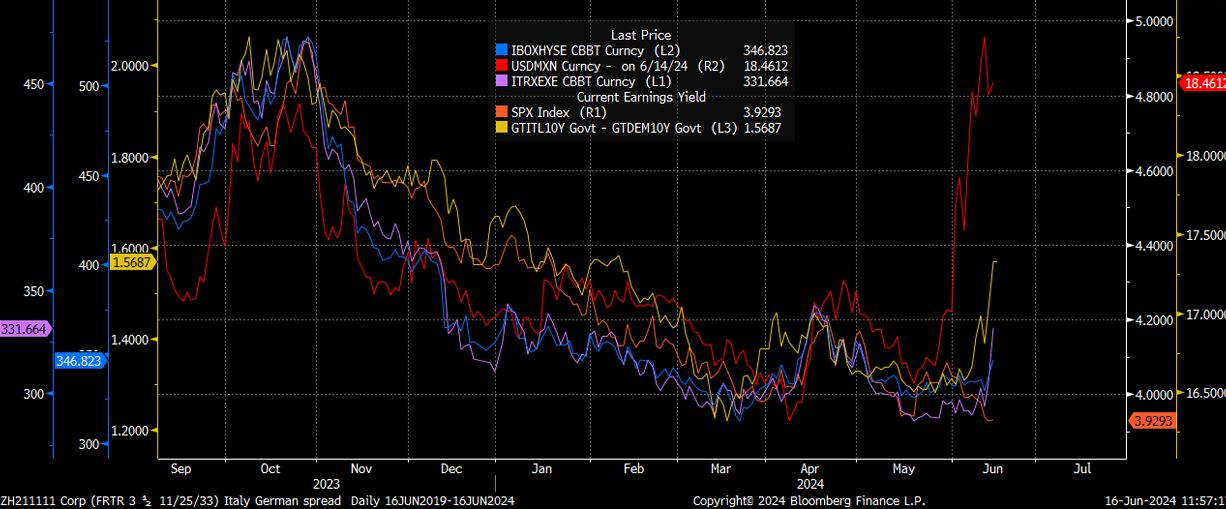
This fits perfectly with what we have been seeing in the pair and in the spread between Italian and German 10-year bonds, which we have been discussing for several weeks now. Whether the events in France are the real source of concern for stability across Europe or whether the market is simply using the headlines as a “reason” to reduce risk, the risk reduction is real. This is happening across high yield spreads in Europe and the US and so far the only immune entity has been the market cap weighted , as seen in the decline in earnings yield.
Before drawing conclusions about why US rates are falling, you have to look at things globally: if European rates are falling sharply, you have to realize that the fall in US rates is a movement of flight to safety. This means that paying attention to spreads is more important than ever because right now the idea that falling rates lead to rising stocks is wrong; Stocks will rise with falling rates if spreads narrow, and right now, spreads are widening, and that’s why he’s not going up and instead he’s going down.
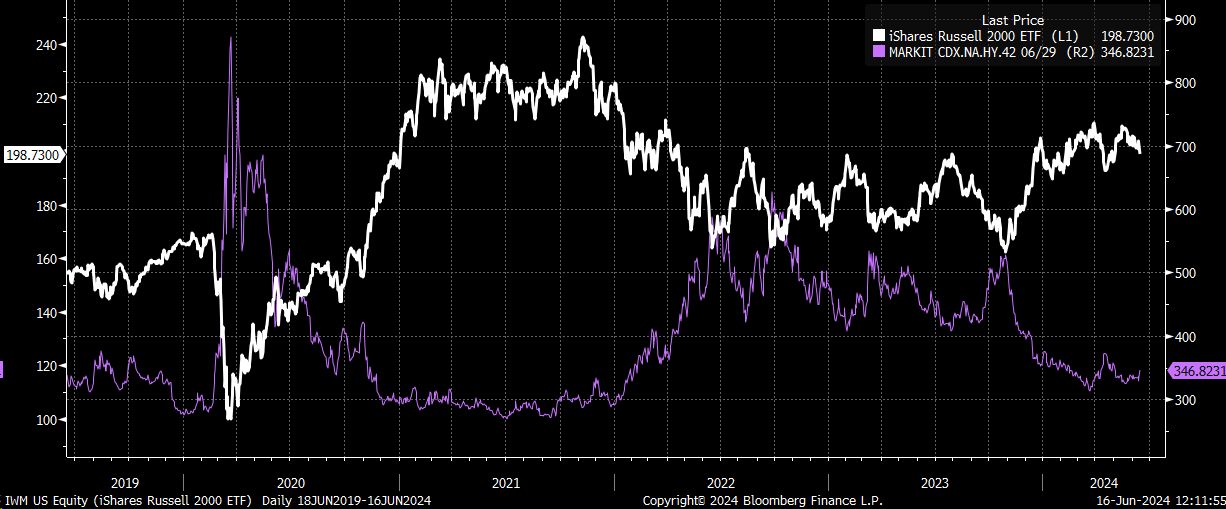
That the ETF is falling and other ETFs like the and the are rising is the best sign that spreads are widening and the ETF is likely to fall as a result.
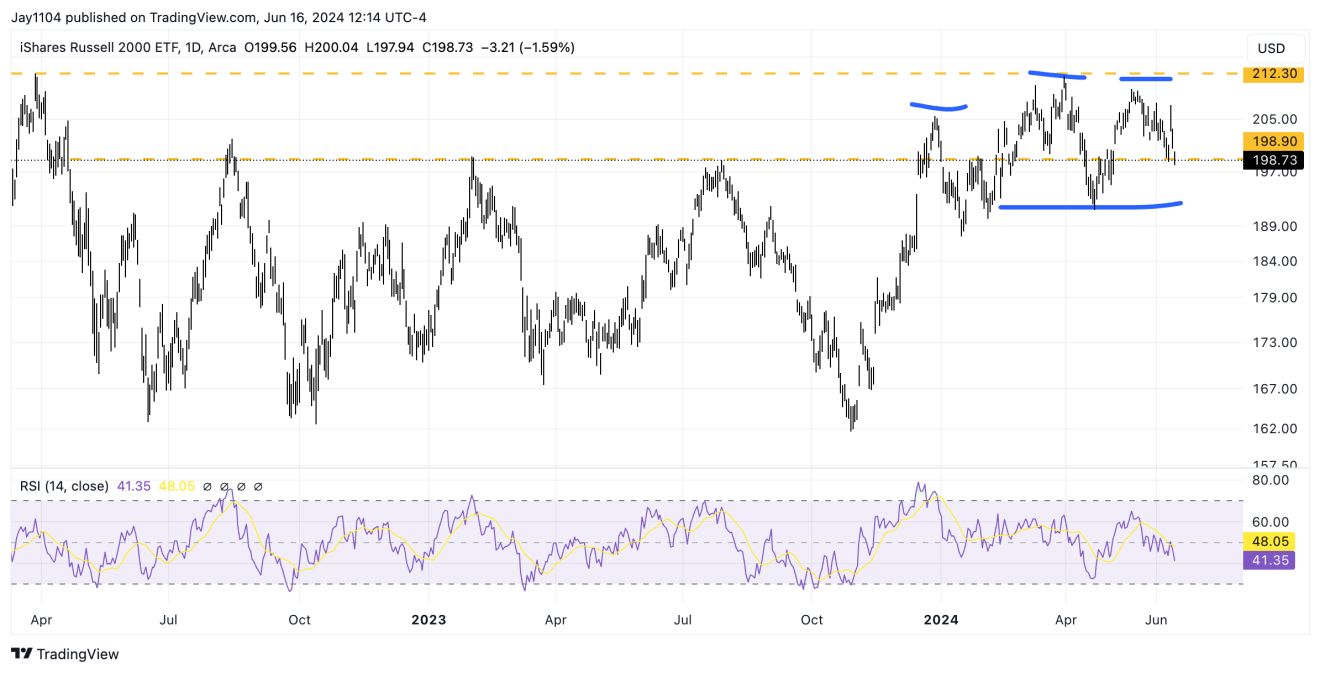
Right now, the IWM is at an important point, at $198.75, which has been a resistance and support level since August 2022. A breakout of this zone would mean an even more critical test of the neckline of a double ceiling around $191.50.
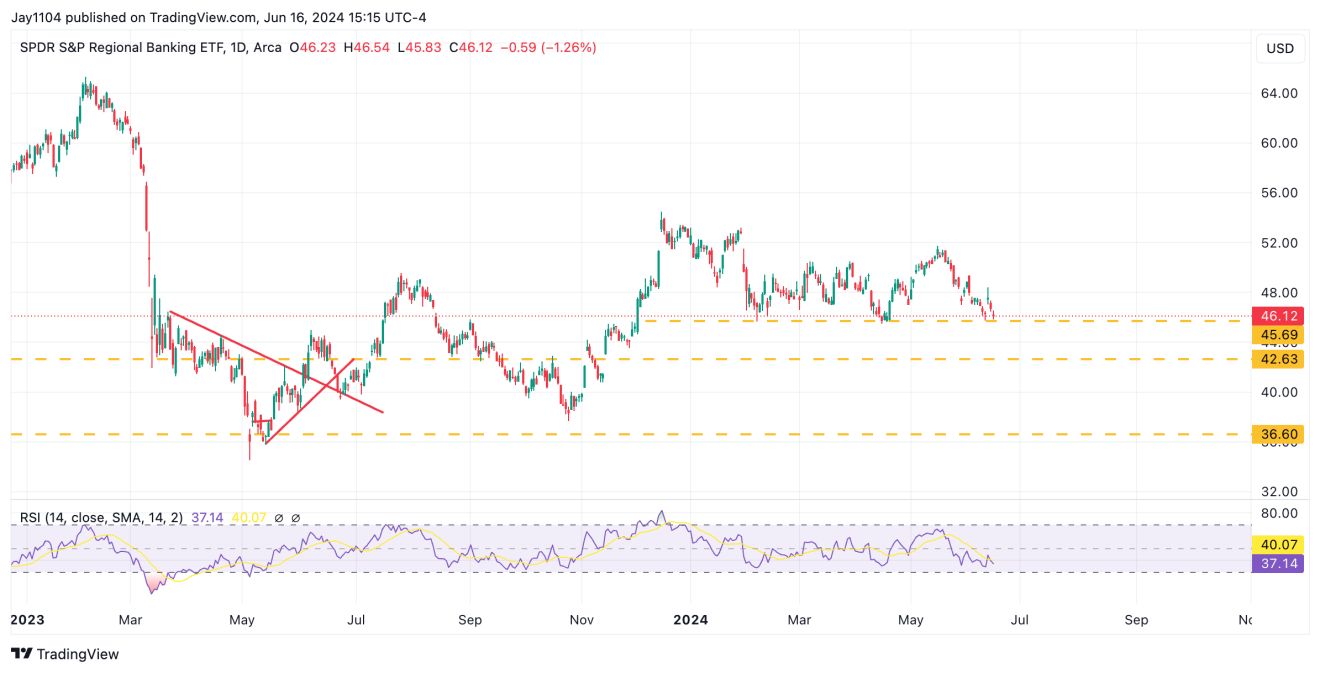
More discreet data and wider spreads would not benefit regional banks (or any bank). So, you have to watch it very closely, especially if it breaks the support level around $46. This is a significant level, especially with a gap open between 8% and 9% below the current price.
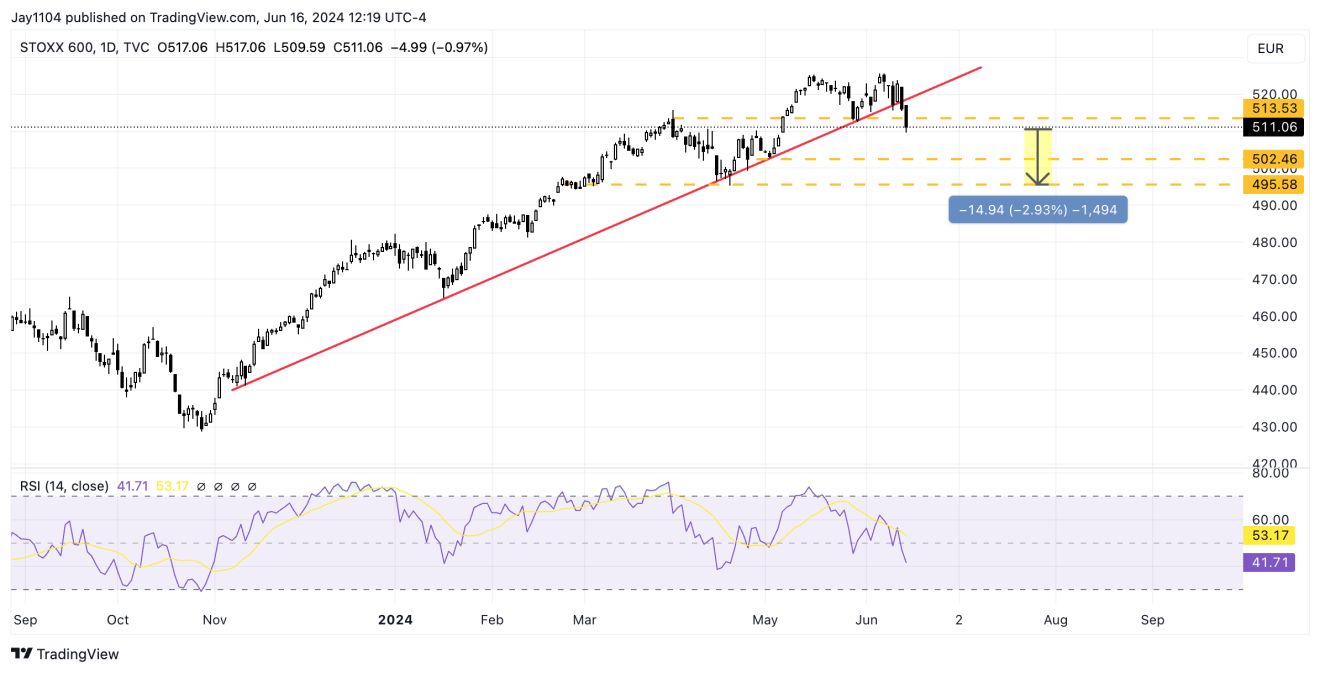
It broke a major uptrend last week, also broke support at 513, and has a clear downtrend on the RSI. For now, the next support zone seems to be around 502.50, followed by 495.
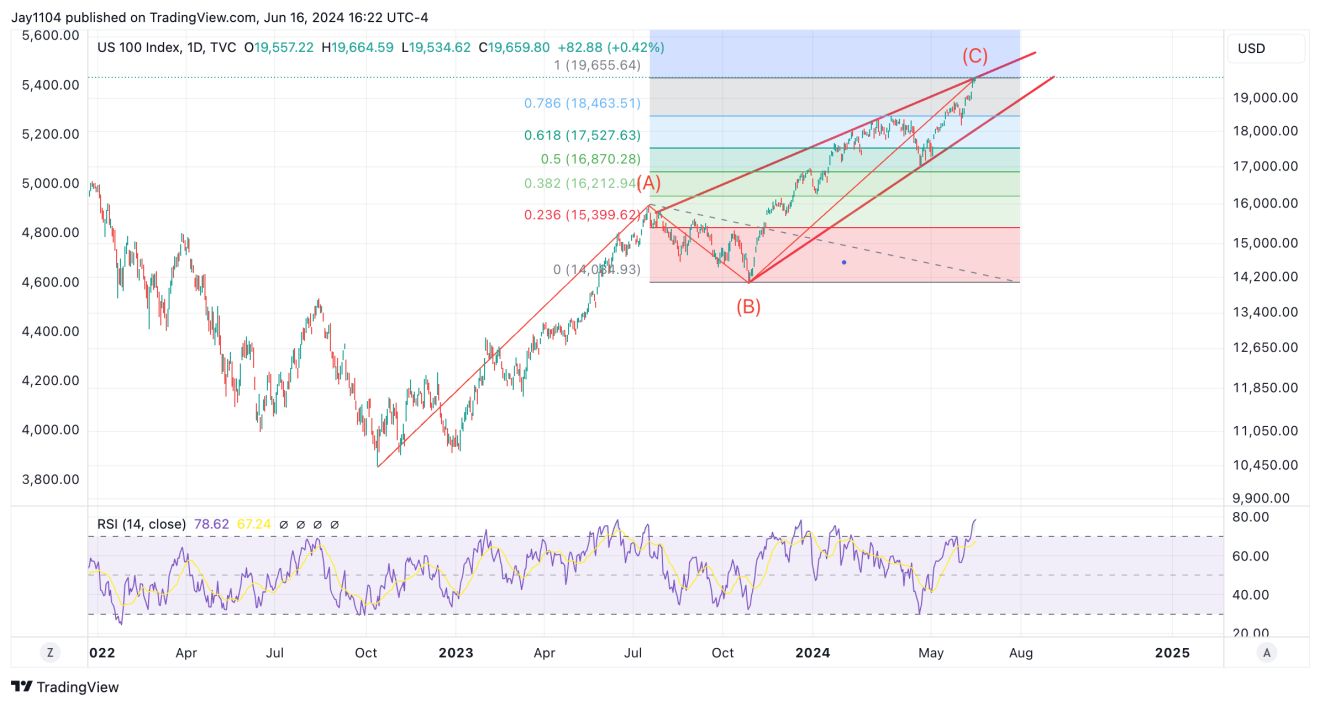
Nasdaq 100: Is a trend reversal possible at this time?
If a significant market turnaround occurs, it could be close; The recently extended 100% from the intraday lows recorded in October 2022, July 2023 highs and October 2023 lows. Therefore, when using things like Fibonacci levels, it does not mean that you have to change your heading down, but if there was a place, based on Fibonacci retracements, this is the region where such a decline could begin.
Given how stretched valuations are and the weakness we’re seeing in the rest of the market, along with widening credit spreads and the expiration schedule of the VIX and equity options, this seems like a time and a ideal place to see a trend change, with a drop back to 18,000 as a reasonable first stop.
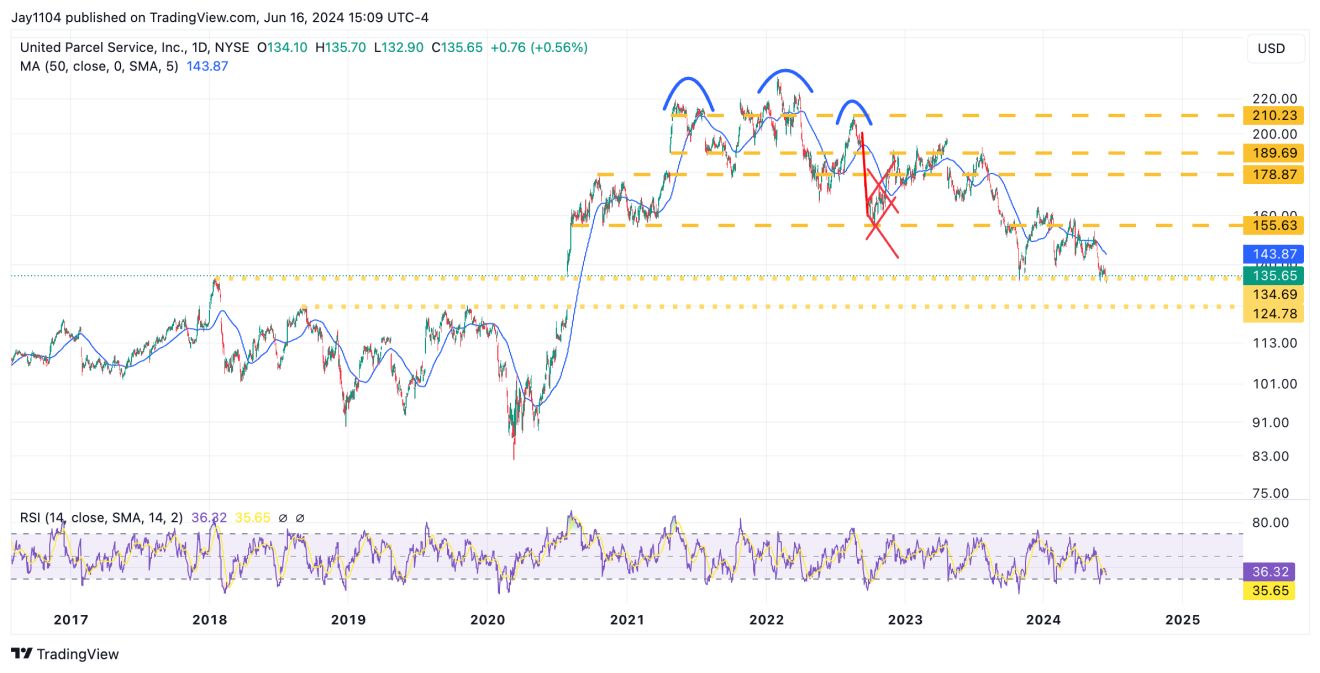
I’m not sure how many have seen this chart recently, but it is interesting as it sits above the 2018 support level. A break of this support level could potentially result in the stock falling further and filling a gap that It dates back to July 2020, almost $125.
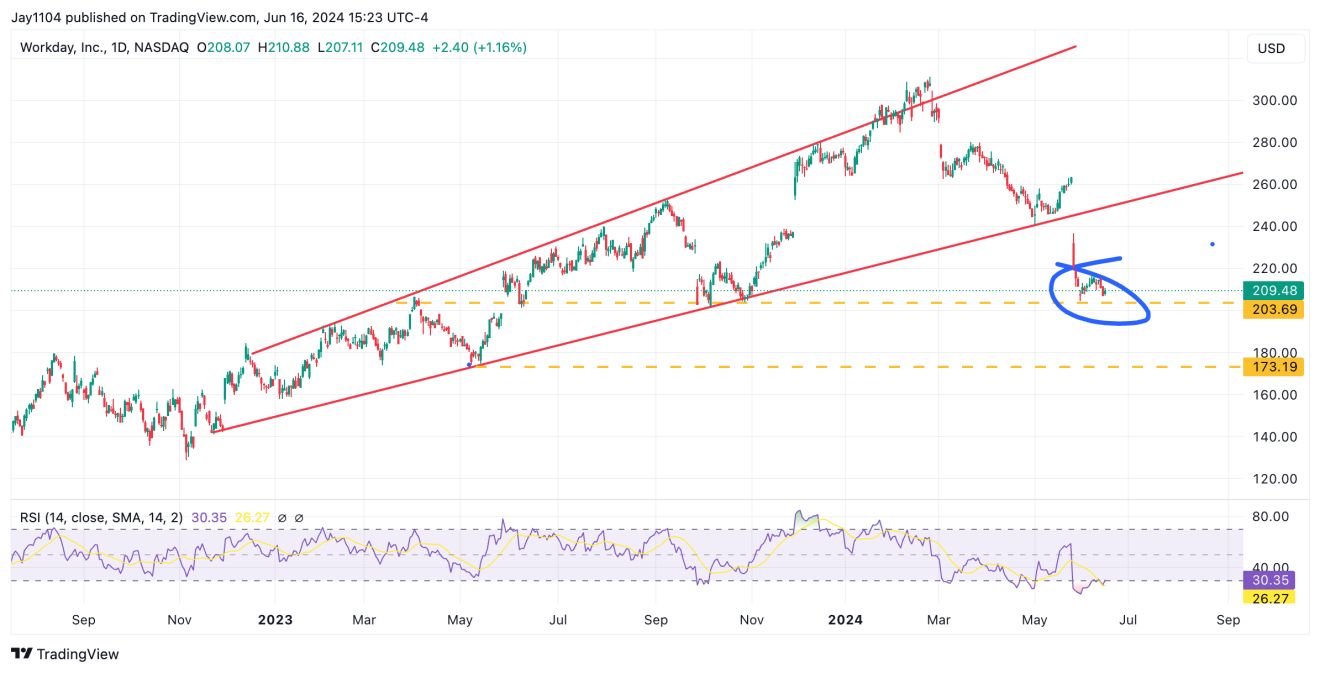
The Workday chart is one of the ugliest I’ve seen recently. The region between $200 and $220 is very important because a move below $200 opens a path to considerably lower levels, perhaps $170, with very little, if any, support between them, even though the stocks are already oversold on the RSI.


