The price of bitcoin (BTC) remains in the lateral range in which it has been “stuck” for more than 3 months.
After reaching its most recent all-time high above $73,000, it entered a period of oscillation between that price and $56,000.
At the time of this publication, each BTC is traded on major exchanges for $61,400.
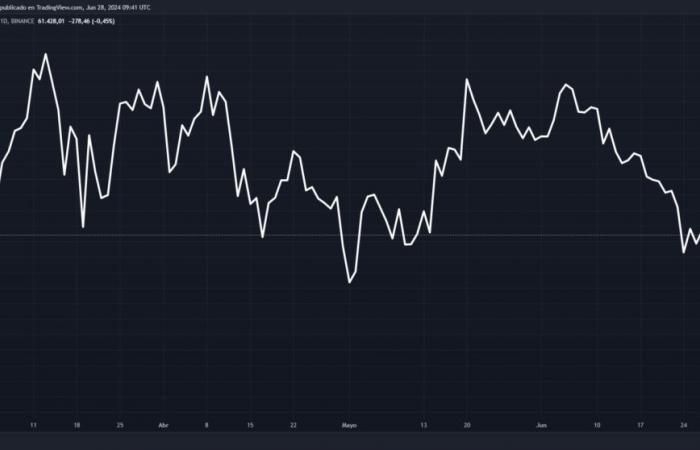
The following chart, provided by TradingView, shows how Bitcoin has moved since March. The sideways movement referred to here is evident:
But this lateralization will not last forever. Sooner or later, BTC will have to break the range and break out. The question is where to? Will it go above $74,000 towards new all-time highs? Or will it crash below $56,000?
If history repeats itself…
To answer the question we just asked, it may be useful to analyze historical patterns in the price of bitcoin.
The lack of momentum that Bitcoin is currently showing bears similarities to the behavior it experienced a year ago.
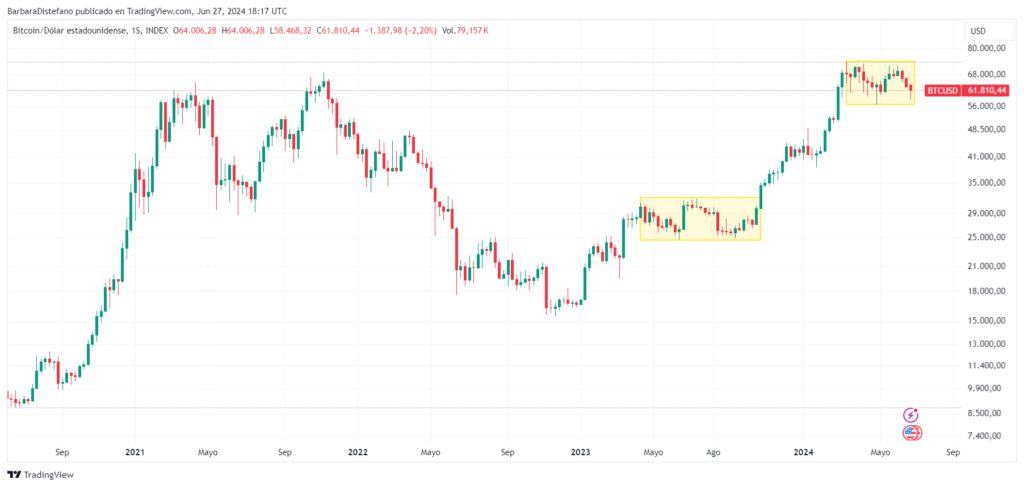
As the following graph shows, after seeing a strong rise at the beginning of last year, bitcoin remained in a lateralization phase that lasted six months. It was from April to October 2023 when it culminated with a bull run (bull run).


Long periods of lateralization are normal after increases to consolidate the increase. Likewise, its extension over time reflects the presence of solid support where demand increases, which is why it usually reflects a bullish signal.
“If that era were to happen again in BTC (something I see as quite likely), we will be in range until September 2024,” commented the trader known as SantinoCripto. Due to market psychology, he sees it possible that BTC will enter an upward trend from then on until it rises to $120,000 (USD).
Something that motivates this scenario is that autumn begins in the northern hemisphere in September, a season in which markets tend to rise, including bitcoin. In fact, its last bull market, which lasted from 2020 to 2021, began at that time, showing a decline during the summer, when risk demand usually decreases.
Specialists such as those who make up the Bernstein broker team also indicate that They expect the market to improve around the US presidential elections at the end of the year. As reported by CriptoNoticias, they attribute this to the chances of victory of the Republican candidate Donald Trump while he is in favor of cryptocurrencies.
He bull run that broke the long lateral phase last year was driven in part by the expected launch of bitcoin exchange-traded funds (ETFs) in the United States, which occurred in early 2024. Now, Ethereum ones are scheduled to be launched soon, Therefore, institutional demand in the digital asset market could be motivated.
Bitcoin sales by miners hinder bitcoin’s rise
Bitcoin is currently trading at the low end of the current period of lateralization. Its price is 15% below the new all-time high it recorded in March of USD 73,700.
Meanwhile, Bitcoin miners continue to capitulate since the halving occurred in April. Because this event halves their rewards, many are forced to sell their holdings to maintain their operations or withdraw from the activity.
“We are still waiting for the hash rate to rebound, which is an important sign that miners have stopped selling,” said analyst Willy Woo. For now, this metric, which shows the level of competition, continues to decline.
Furthermore, Woo believes that in this period of lateralization, There are speculators who will get tired and close their positions.. “Get ready for some very boring price action for many more weeks,” he concluded.


