Background
The traditional source of data for measuring household consumption expenditure in India is the Household Consumption Expenditure Survey (HCES). Broad results of the most recent survey conducted in 2022-23 were released. Since the 68th survey in 2011-12, enormous social, economic, and technological changes have altered how households spend and consume. In addition, there are changes in the financial autonomy of household members, changes in the organization of the retail sector, growth in prosperity, and innovation in the goods and services available to households.
The National Sample Survey Office (NSSO), which conducts the survey, also notes that the current survey has undergone some changes as compared to the previous surveys on consumption expenditure. These include an increase in the number of items from 347 to 405, a separate questionnaire for food items, consumables and services and durable goods along with a questionnaire for household characteristics and demographic particulars as opposed to a single questionnaire earlier, multiple visits for data collection as opposed to a single visit earlier and computer-assisted interview compared to the more traditional interview method. Given the number of changes introduced in the current survey, NSSO observes that comparison with earlier surveys may not be accurate. However, some qualified comparison of the results of the current expenditure survey with those of earlier surveys may offer clues into changes in the share of expenditure on energy.
Energy Share of Consumption Expenditure
The HCES collected data from 8,723 villages and 6,115 urban blocks spread over the entire country covering 261,746 households with 155,014 households in rural areas (59 percent) and 106,732 households in urban areas (41 percent). The two energy-related items covered in the survey are fuel and light and conveyance. Based on the 2011-12 survey (68th round), fuel & light expenditure includes expenditure on coke, charcoal and chips, dung, kerosene (obtained through the public distribution system [PDS] or through the open market), coal, liquefied petroleum gas (LPG) and electricity. Conveyance includes fares charged for public transportation (air, train, bus, three-wheeler and others), school buses, and rickshaws (hand-drawn and motorized). Petrol and diesel consumed in personal four and two-wheeled vehicles are likely to be covered under the item “other conveyance expenses.”
According to the 2022-23 survey, rural monthly per capita consumption expenditure (MPCE) on energy and energy services (fuel & light plus conveyance) was INR536 while it was INR 959 in urban areas. The total MPCE was INR3860 in rural households and INR6521 in urban households. Rural household expenditure on energy and energy services was 13.8 percent of total consumption expenditure while the share of urban household expenditure on energy and energy services was 14.7 percent. As per the 2011-12 survey, the all-India average MPCE on fuel & light and conveyance was INR174 and that of urban households was INR347. The total MPCE was INR1,430 in rural areas and INR2,630 in urban areas. The share of energy and energy services (fuel & light and conveyance) in total MPCE was 12 percent in rural areas and 13 percent in urban areas. The MPCE for urban areas has increased by an annualized rate of about 8.6 percent in urban areas and by about 9.4 percent in rural areas from 2011-12 to 2022-23. The MPCE for energy and energy services grew by an annualized rate of 10.7 percent in rural areas while it grew by an annualized rate of 9.6 percent in urban areas in the same period. Expenditure on energy and energy services grew faster than expenditure on food and non-food expenditure. This could either mean energy prices increased more than that of other commodities or that households are consuming more energy than they did before.
Trends
The MPCE share of energy and energy services in total MPCE is higher in urban areas than in rural areas in 2011-12 as well as in 2022-23 when energy used for conveyance is included. This suggests that higher consumption of energy and energy services in urban areas, especially for transportation. This is in line with one of the broad observations of the survey that non-food expenditure (including expenditure on energy and energy services) is higher in urban areas than in rural areas. Despite the dramatic increase in the price of petroleum products in the early 2020s, partly because of the conflict over Ukraine and partly because of the reduction in subsidies and increase in taxes, the share of MPCE on energy services has not increased proportionally. This could indicate a reduction in energy consumption by households.
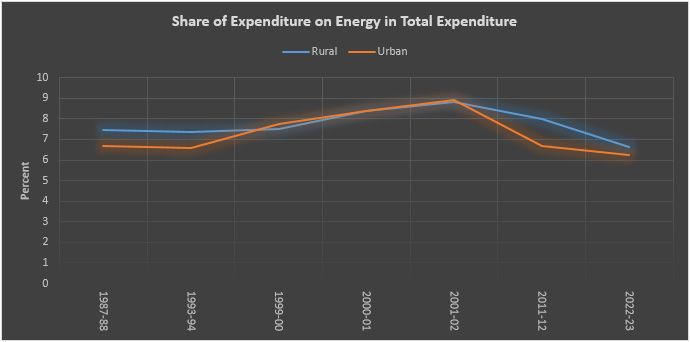
Historically, when energy used for conveyance is excluded the share of energy as a percent of total MPCE is higher in rural areas compared to that in urban areas. This implies that lower MPCE households are poorer and a higher share of their expenses goes to purchasing energy services, particularly for lighting and cooking. In 2001-02 the share of expenditure on energy services for lighting and cooking in total MPCE of urban and rural households were roughly the same at around 9 percent but they have diverged again in subsequent rounds of surveys.
According to the government data, in 2023, the average per-person income was INR91,481. This is a statistical artifact that distributes national income across persons equally. For a more realistic picture, the minimum wage earned in a poor household in a medium Indian state may be considered. In household of five persons with income from one adult semiskilled male, one adult female agricultural worker and three dependents may be considered. Assuming two economically active members of the household work 15 days a month, the combined monthly income of the household is about INR14,250. Based on MPCE on energy and energy services (including energy used for conveyance) the household spends 3.2 percent of their monthly income on energy and energy services. As per one definition of energy poverty in Western literature, if a household spends more than 10 percent of its monthly income on energy and energy services it is an “energy-poor” household. However, the low figure for energy expenditure expressed as a share of income in India does not mean that average households are not “energy poor”. The 10-percent expenditure definition of energy poverty in Western countries uses minimum energy needs for lighting, cooking, communication, travel and most importantly comfort (space heating) as essential minimum consumption. Energy used for conveyance is not included. When a household spends more than 10 percent of its income on consuming the minimum quantity of energy required for decent and comfortable living it is classified as an energy-poor household. In India, a household that spends about 3-4 percent of its income on energy is probably an energy-poor and income-poor household which does not consume even the minimum required for a decent living.
Source: Reports of the National Sample Survey Organization (NSSO) various issues
Lydia Powell is a Distinguished Fellow at the Observer Research Foundation.
Akhilesh Sati is a Program Manager at the Observer Research Foundation.
Vinod Kumar Tomar is an Assistant Manager at the Observer Research Foundation.
The views expressed above belong to the author(s). ORF research and analyzes now available on Telegram! Click here to access our curated content — blogs, longforms and interviews.


