- Bitcoin’s value fell more than 4% in the last seven days.
- Market indicators continued to be bearish for BTC.
Bitcoin [BTC] The performance of the last seven days was disappointing as its price fell below the $65,000 mark. The price corrections caused fear among investors. However, the trend could end soon as historical trends hint at a possible market bottom.
Bitcoin hits bottom in the market
CoinMarketCap’s data revealed that BTC was down almost 4.5% in the last seven days. In fact, in the last 24 hours alone, the price of the king of cryptocurrencies fell more than 2%.
At the time of writing, Bitcoin was trading at $63,931.44 with a market cap of over $1.26 trillion.
Meanwhile, Santiment recently posted a tweet highlighting an interesting development, and the market was mainly fearful or uninterested in Bitcoin as prices ranged between $65,000 and $66,000.
The tweet read: “This extended level of FUD is rare as traders continue to capitulate. “BTC trader fatigue, combined with whale accumulation, typically leads to patient-rewarding bounces.”
To see if Bitcoin was really close to its market bottom, AMBCrypto analyzed Glassnode data.
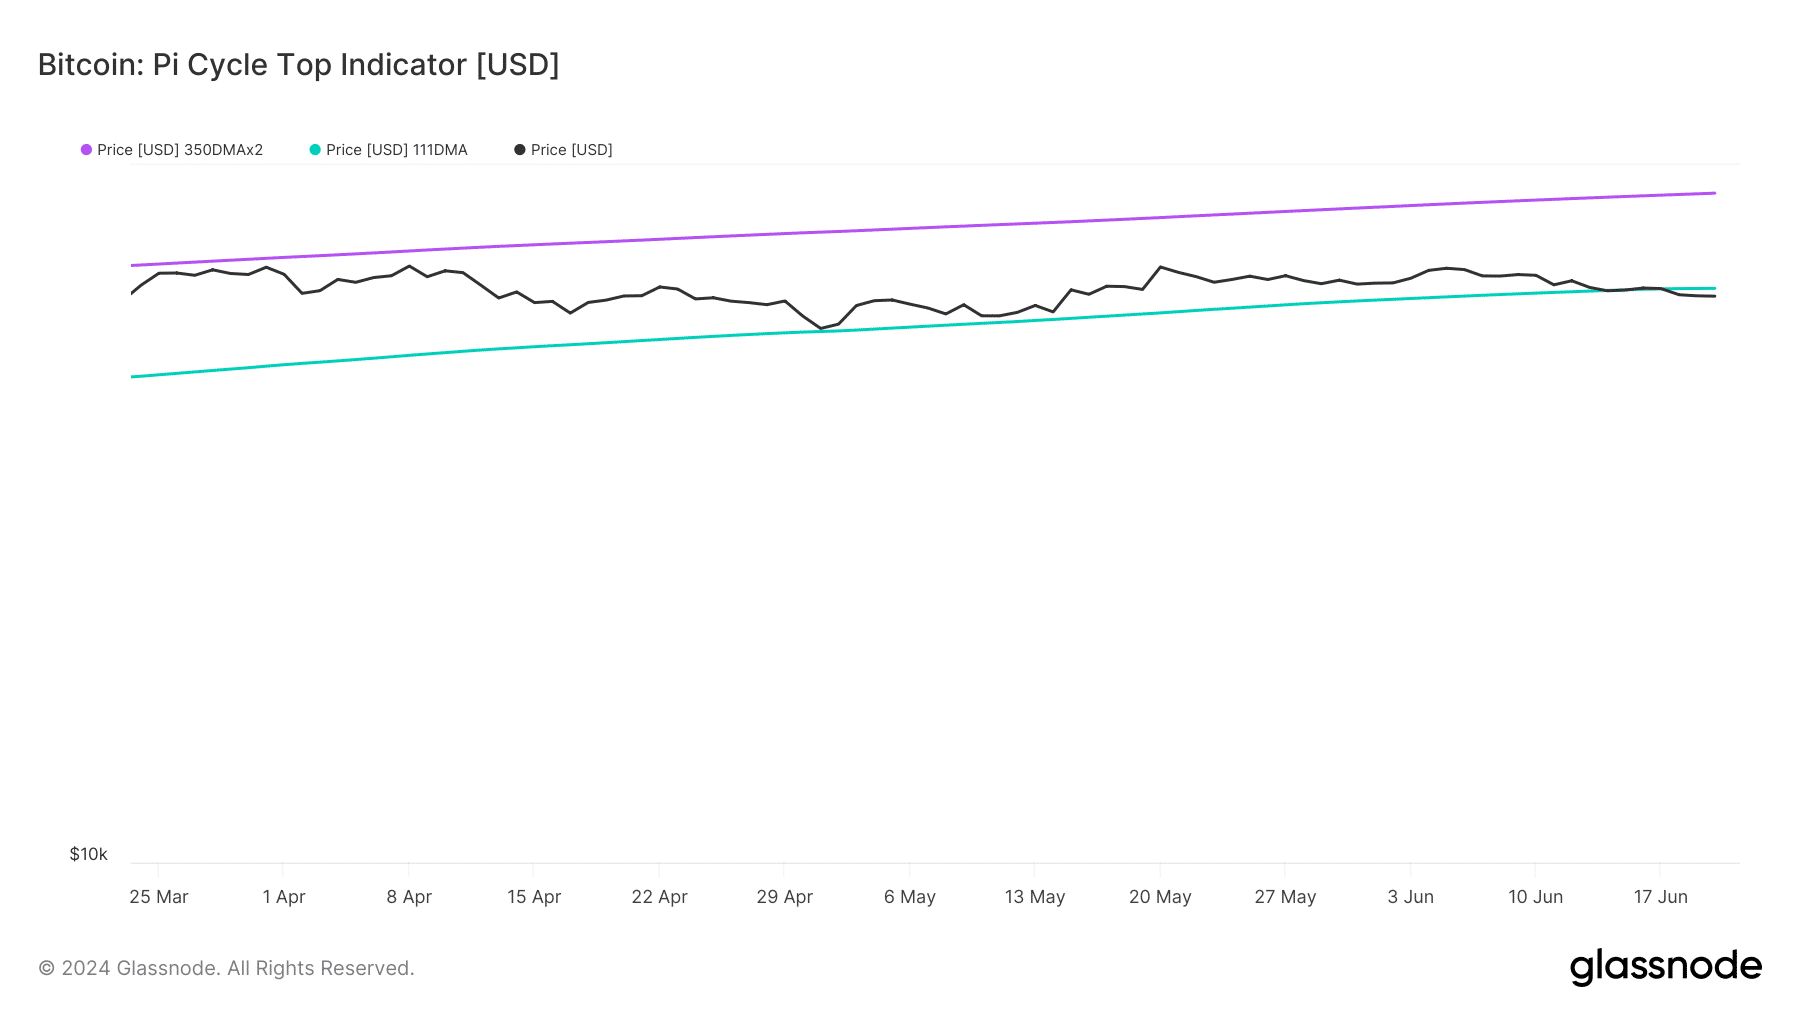
The Pi Cycle Top indicator noted that the BTC price had fallen from its perceived market low of $66.5 thousand. This clearly hinted at a price increase in the coming days.
To start, the Pi Cycle indicator is made up of the 111-day moving average and a 2x multiple of the 350-day moving average of the Bitcoin price.
Going forward, if things turn bullish, then BTC could also reach its market high of $91,000 in the coming weeks or months.
Source: Glassnode
Looking to the future
Like the aforementioned data, some other metrics also looked bullish. For example, at press time, BTC fear and greed index was worth 37%, meaning the market was in a “fear” phase.
Whenever the metric reaches this level, it indicates that the chances of a bullish rally are high.
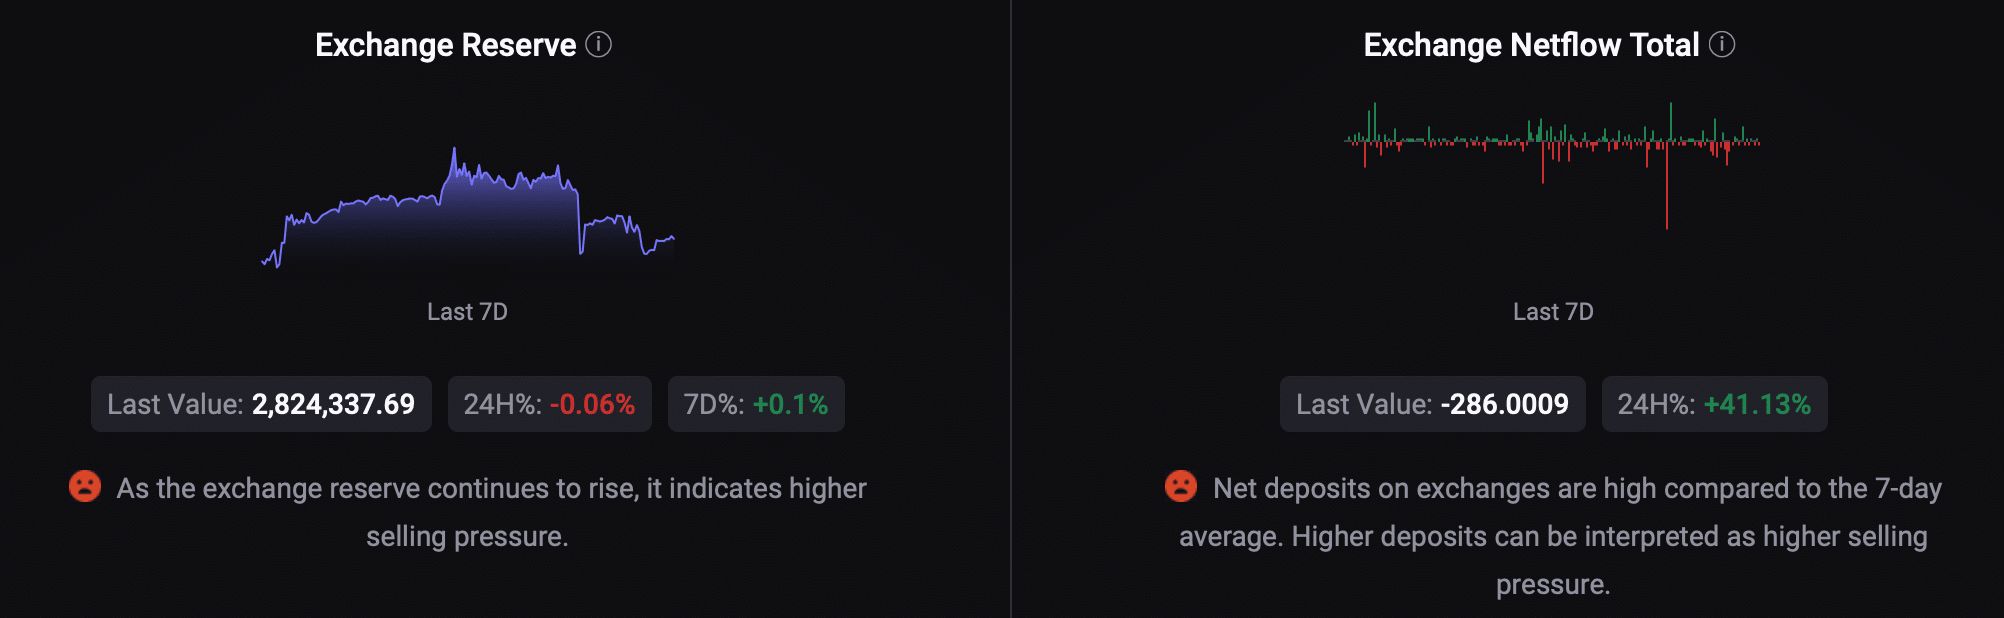
However, AMBCrypto’s look at CryptoQuant data revealed some bearish metrics. For example, the BTC currency reserve was increasing.
Its net deposit on exchanges was high compared to the average of the last seven days, which means that the selling pressure on Bitcoin was high.
Source: CryptoQuant
Read Bitcoins [BTC] Price prediction 2024-25
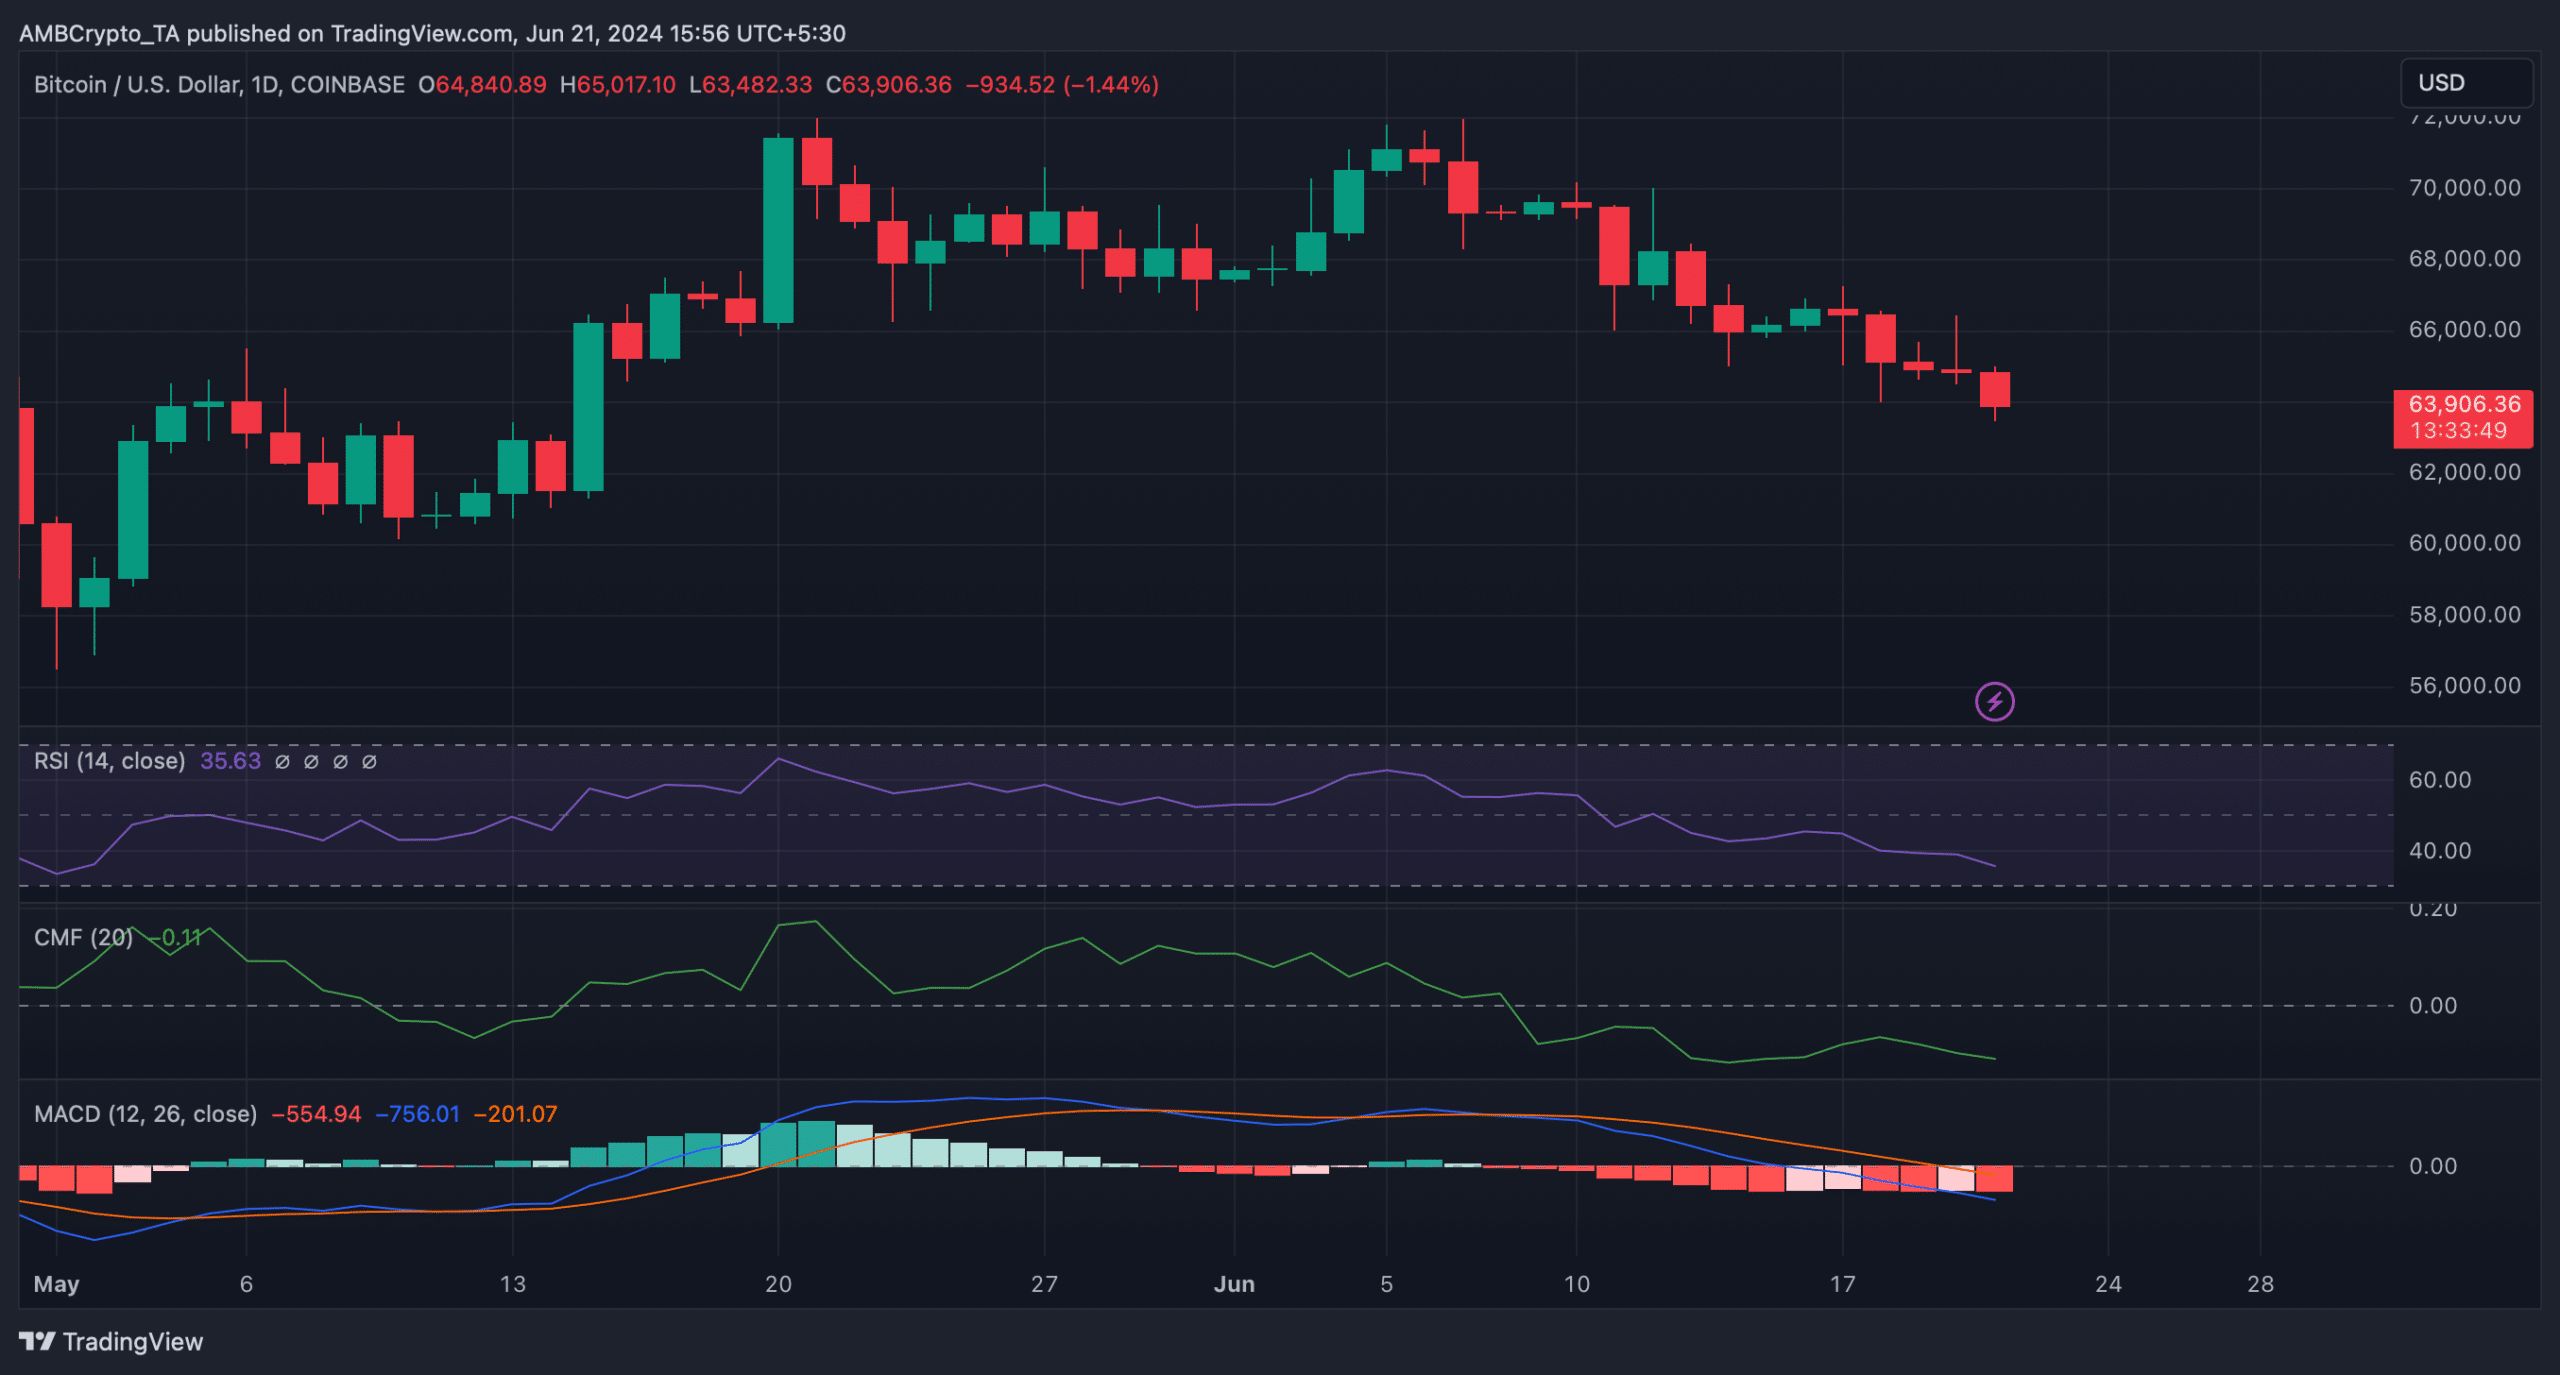
We then planned to take a look at the daily BTC chart to better understand if the bulls were preparing for a rally. We found that most of the indicators were bearish.
The MACD showed a clear bearish advantage in the market. The Relative Strength Index (RSI) recorded a decline. BTC’s Chaikin Money Flow (CMF) also followed a similar downward trend, hinting at a continued price decline.
Source: TradingView
Next: LayerZero’s ZRO cryptocurrency is off to a rocky start – can it recover soon?
This is an automatic translation of our English version.


