
Key facts:
-
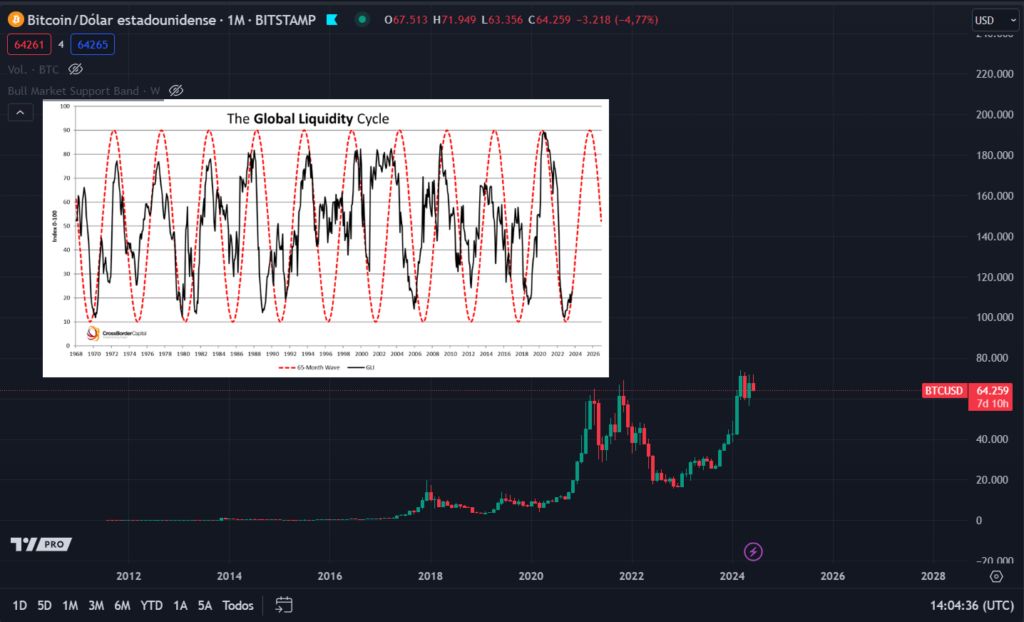
Global liquidity behaves similarly to the price of bitcoin.
-
When bitcoin bottomed in 2022/2023, so did global liquidity.
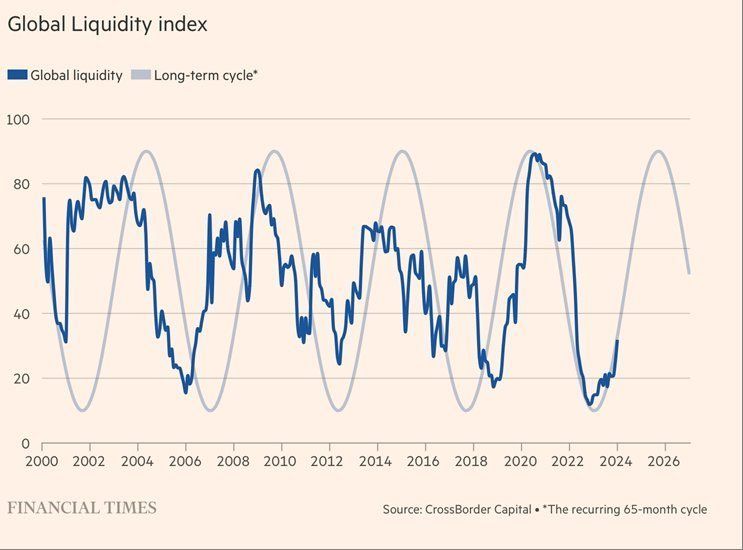
A macroeconomic pattern would support the price of bitcoin for the remainder of 2024 and all of 2025. This is what the Global Liquidity Index demonstrates, for which the availability of money in hand and the borrowing capacity of investors and consumers would be about to grow steadily. In markets, an increase in liquidity usually goes hand in hand with increases in the price of assets, including bitcoin and altcoins.
According to the aforementioned indicator, the liquidity or money available worldwide behaves in the form of sine waves. Each with an approximate duration of 5 or 6 and a half years, equivalent to 65 months.
At the time of writing this note, global liquidity is beginning the upward wave of a new sinusoidal figure after having bottomed in the previous one, at the end of 2022 and beginning of 2023.
In 2019, the global liquidity index began to reverse in a new wave. The same goes for the price of bitcoin (BTC), which, in the next year and a half, reached the famous all-time high of USD 69,000.
Recently, the price of bitcoin also emulated the liquidity index when starting in late 2022 the bull market which we are still in and which is estimated to last until the end of 2025, as shown in the previous graph.

How does the global liquidity index work?
The global liquidity index was originally estimated using the periods between 1965-2000 as a base, the date from which it began to be extrapolated with longitudinal data. It takes into account 80 world economies and especially the money in the financial markets of the private sectors.
Although this index shows some specific deviations in certain periodssuch as between 1994 and 1998, at peaks and at bottoms, usually retains its sinusoidal shape and is quite useful for predicting long financial cycles.


