Journalist
Published in: June 23, 2024
- The loss of historical support level puts BTC in prime position for another decline.
- The MVRV Long/Short spread revealed that the coin price could recover later in the cycle.
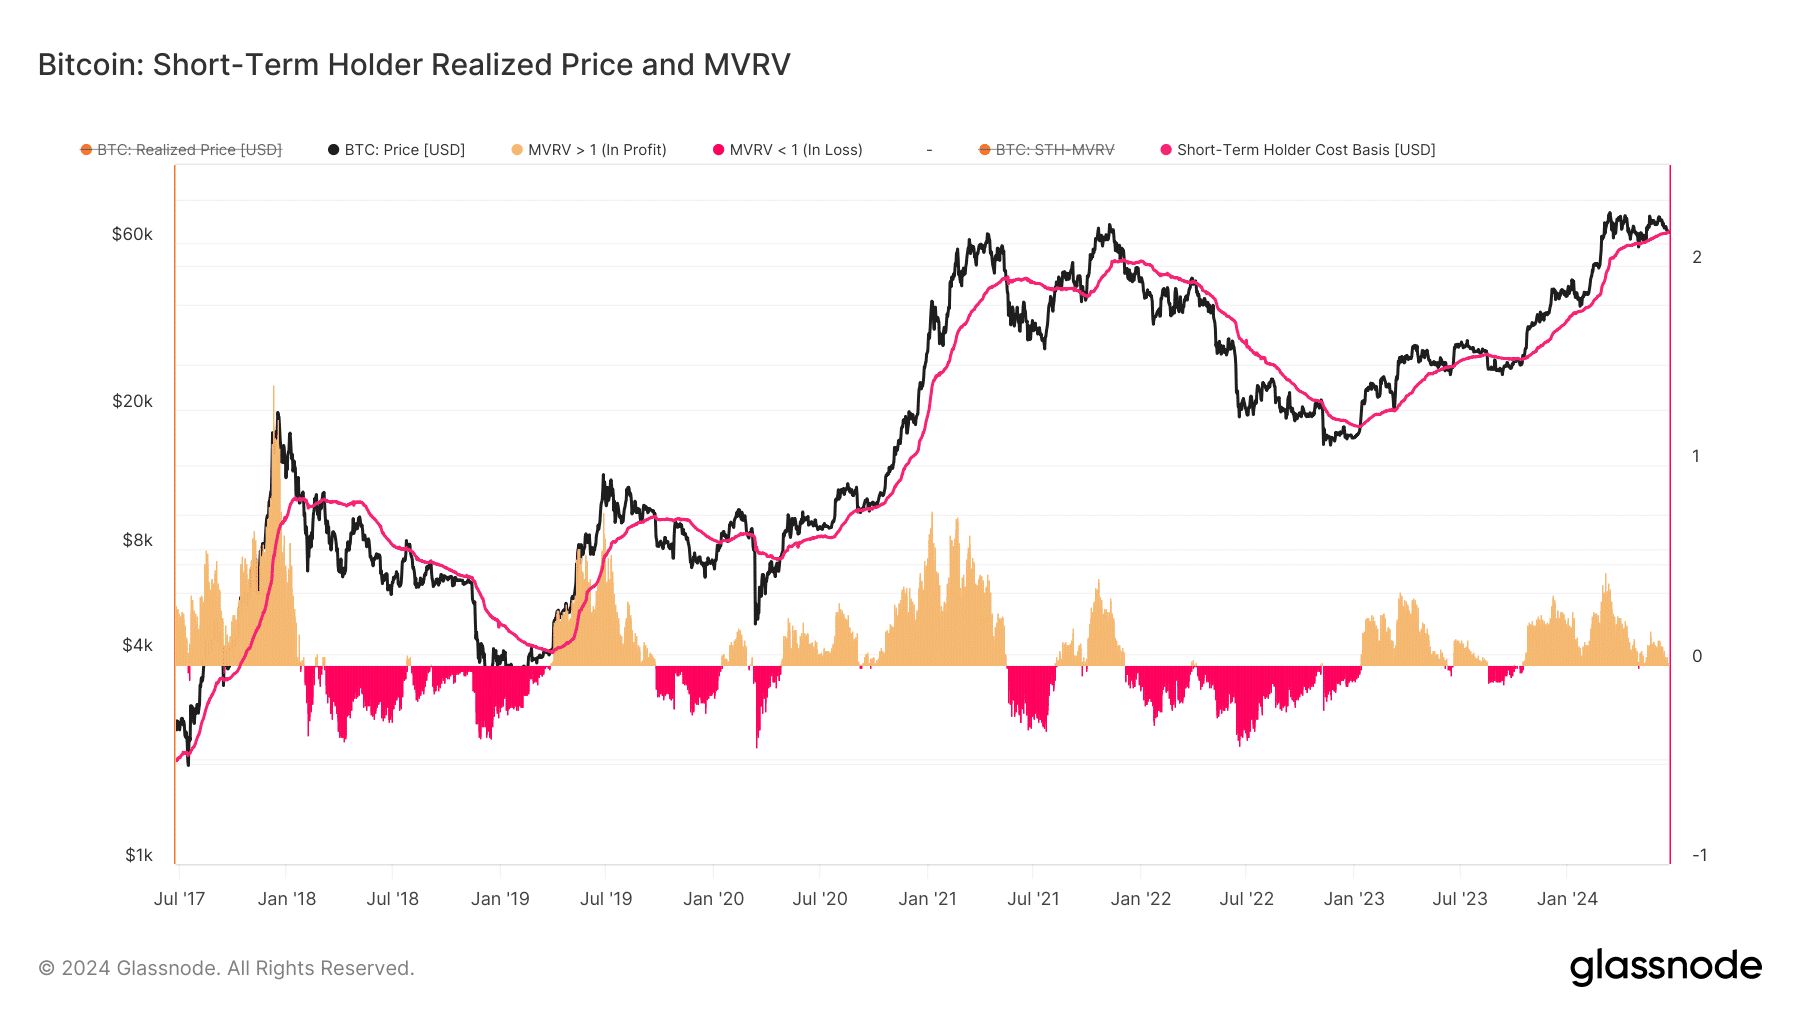
bitcoin [BTC] has fallen below the Short-Term Holders (STH) realized price, indicating that the price could fall to $61,000 or below $60,000 in the coming days.
According to Glassnode, at the time of this publication, Bitcoin’s STH realized price was $64,372, while BTC’s value was $64,066. Also known as the on-chain cost basis metric is the average value of the STH Bitcoin supply.
Here, it is worth noting that the realized price of STH is valued on the day each coin was last realized on-chain. Typically, STHs are those who purchased BTC within the last 155 days at the latest.
Bitcoin appears to be about to slide
When Bitcoin rises above the realized price, the chance of the price going up increases. This is because the metric acts as support for the price of the cryptocurrency. However, a drop below the threshold raises the possibility of a correction. This was also evident in previous market cycles.
For example, in 2018, the cryptocurrency fell below the realized price of $11,012. A few months later, the price of the coin fell to $8,455. In the final days of 2021, when the price of Bitcoin was $48,962 and the metric was over $53,000, it didn’t take long for the value to drop to $42,306.

Source: Glassnode
If we go by this historical data, the value of BTC is at risk of suffering another correction despite its drop of 7.82% in the last 30 days.
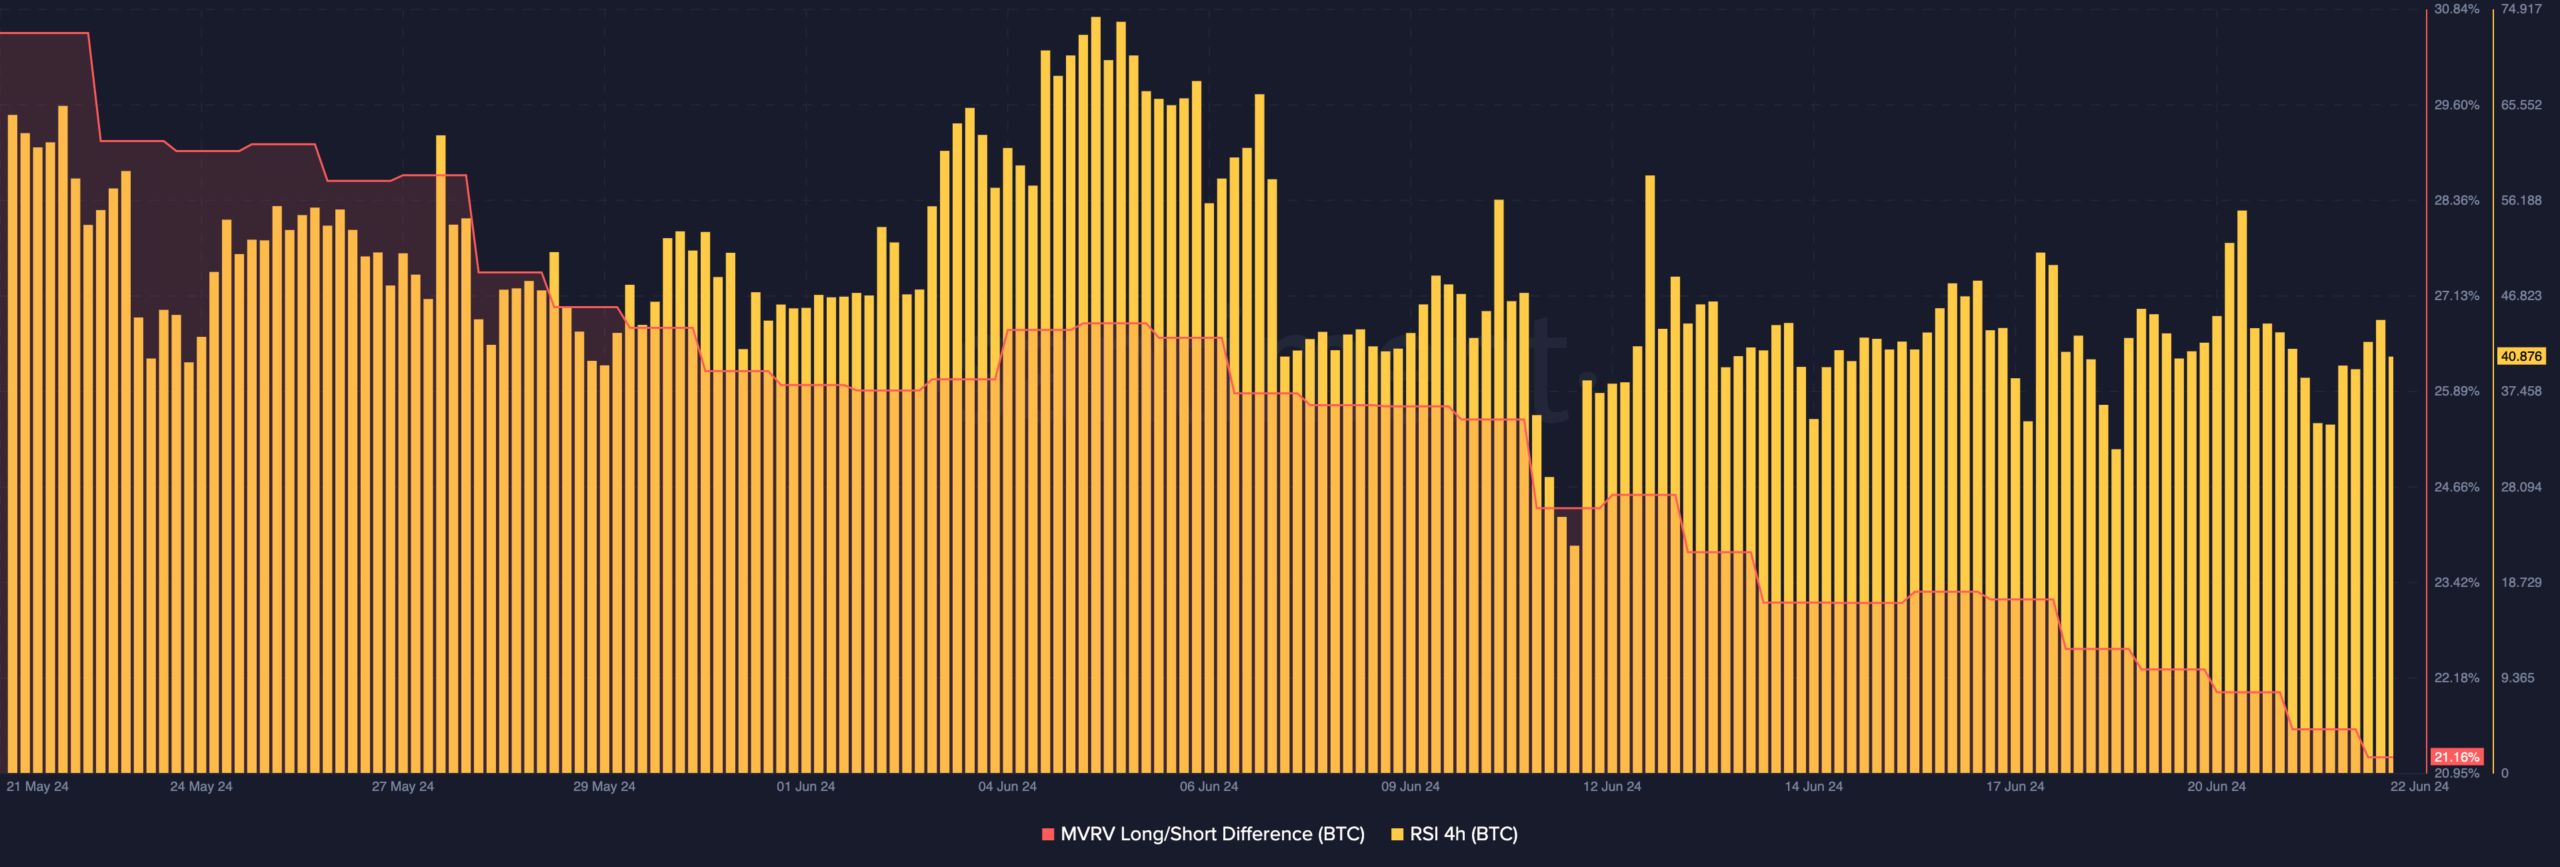
In addition to this, AMBCrypto analyzed the long/short spread between market value and realized value (MVRV). This metric uses the ratio of long-term holders and new money entering Bitcoin to determine potential market deviations.
It’s still a bull market!
If the MVRV Long/Short increases, it means that new money is entering the currency market. However, a fall implies the opposite. At press time, the metric had dropped to 21.16%.
This is a sign that BTC has lacked a high level of capital in recent times. Therefore, the price of the currency could decrease in the short term.
However, the metric also reveals whether a cryptocurrency is in a bearish or bullish phase. Since the reading was positive, it means that Bitcoin is still in a bull market. As such, if the price drops to $61,000 the value could be much higher later in the cycle.
Furthermore, the Relative Strength Index (RSI) on the 4-hour chart was 40.87. Here, the RSI measures momentum and shows whether it is bullish or bearish. Its reading was below 50, a sign of bearish momentum.

Source: Santiment
Realistic or not, here is BTC market cap in terms of ETH
Therefore, the bearish BTC prediction could be validated. That said, an analyst at X – Crypto Caesar – predicted that the dip could be an opportunity to buy before another rally begins. He wrote,
“The price realized by the short-term Bitcoin holder generally acts as support in uptrend markets (see chart). It currently costs $63,900. Historically, this has been a good opportunity for BTFD before more bananas arrived. mode.”
Next: Cardano’s long-term price will depend on THESE factors
This is an automatic translation of our English version.
Next: Cardano’s long-term price will depend on THESE factors


